Mobility Data
- 1. 出行数据
- 1.1 滴滴盖亚开发数据计划
- 1.2 纽约市出租车行车位置记录(2013年)
- 1.3 芝加哥出租车行驶记录(2013年至今)
- 1.4 纽约Uber 2014 & 2015接客数据
- 1.5 英国车祸数据(2005-2015)
- 1.6 芝加哥汽车超速数据
- 1.7 芝加哥Divvy共享自行车骑行数据(2013年至今)
- 1.8 Capital 共享单车骑行数据
- 1.9 Bay Area 共享单车骑行数据
- 1.10 Nice Ride 共享单车骑行数据
- 1.11 花旗银行共享单车骑行数据
- 1.12 运用卫星数据跟踪亚马逊热带雨林中的人类轨迹竞赛
- 1.13 纽约出租车管理委员会官方的乘车数据(2009年-2016年)
- 2. 自动驾驶AI训练数据
- 3. Point of Interest (POI) Data
- 4. Social Media with Geo-Tag
- 5. House Price
- 6. Environment
- 数据总结及问题
1. 出行数据
1.1 滴滴盖亚开发数据计划
1.1.1 2016年10月西安市二环局部区域轨迹数据
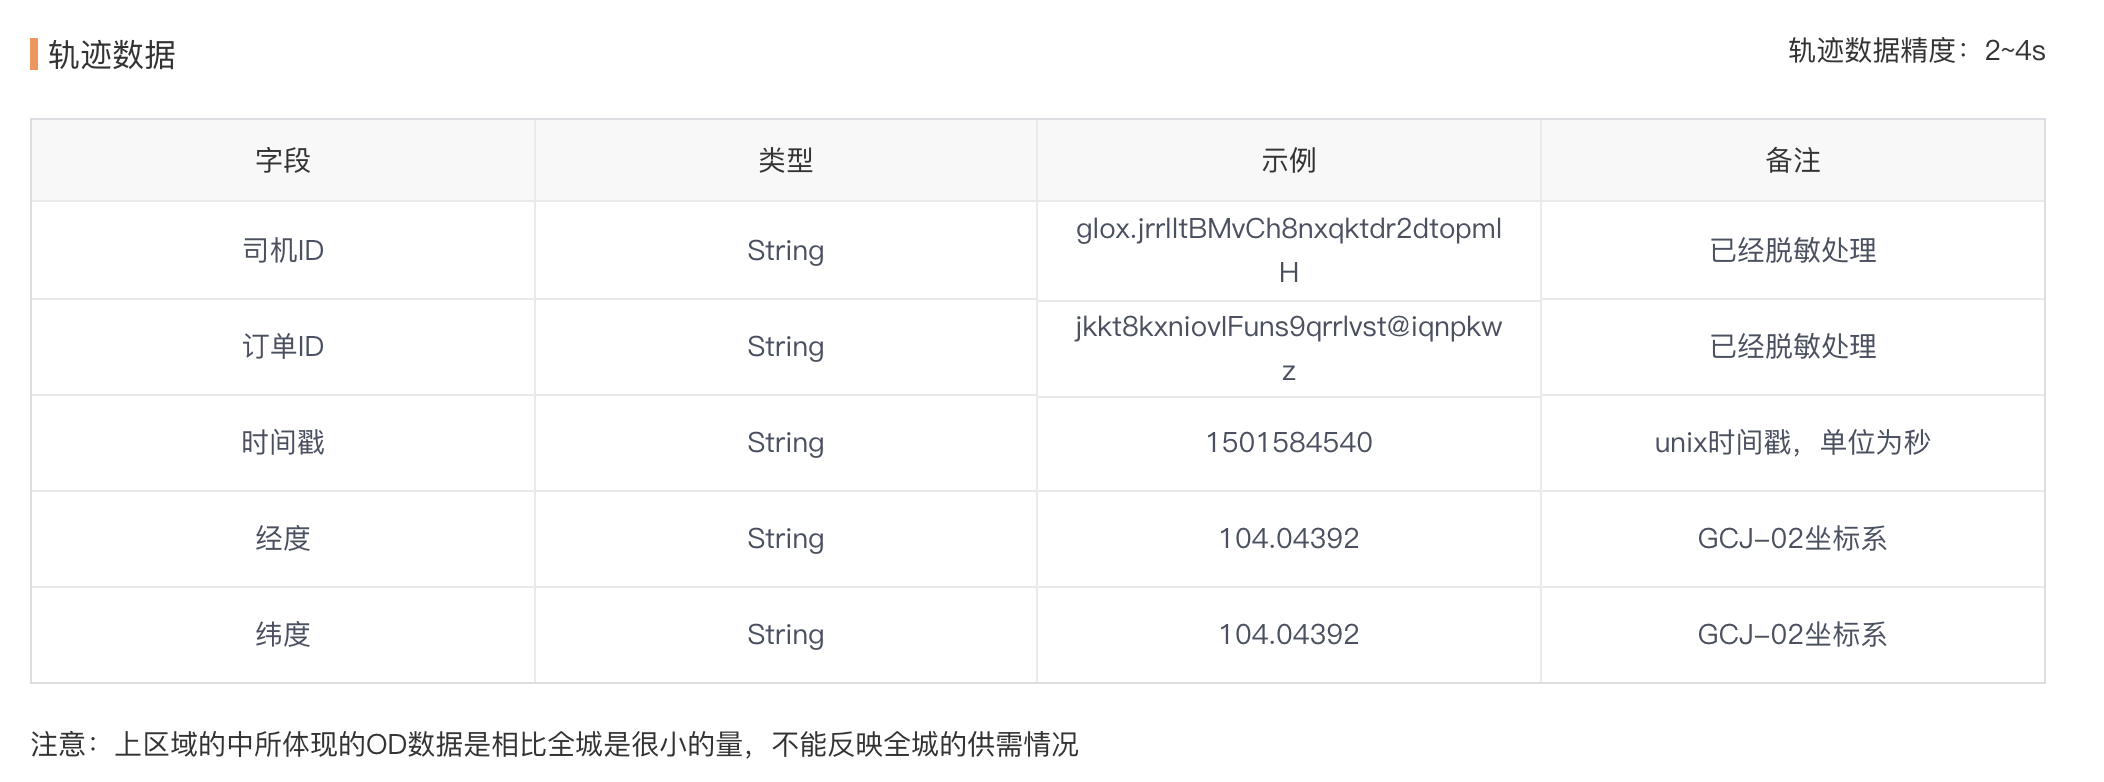
数据描述
本数据来自于西安市二环区域的滴滴快专车平台的订单司机轨迹数据,轨迹点的采集间隔是2-4s。轨迹点经过了绑路的处理,保证了数据都能够对应到实际的道路信息。司机及订单信息进行了加密脱敏匿名化处理。
数据清单
1.1.2 2016年11月西安市二环局部区域轨迹数据
数据描述
本数据来自于西安市二环区域2016年11月滴滴快专车平台的订单司机轨迹数据,轨迹点的采集间隔是2-4s。轨迹点经过了绑路的处理,保证了数据都能够对应到实际的道路信息。司机及订单信息进行了加密脱敏匿名化处理。
数据范围:
[108.92309,34.279936],[109.008833,34.278608];
[109.009348,34.207309],[108.921859,34.204946],
时间范围:2016年11月1日-30日
数据量:5.2G (压缩后)
数据格式: tar.gz
数据库(集)组成:数据包含轨迹数据,总共有30个无后缀名文本文件。数据按照日期进行存储下载。
数据清单
1.1.3 2016年10月成都市二环局部区域轨迹数据
数据描述
本数据来自于成都市二环区域65平方公里2016年10月滴滴快专车平台的订单司机轨迹数据,轨迹点的采集间隔是2-4s。轨迹点经过了绑路的处理,保证了数据都能够对应到实际的道路信息。司机及订单信息进行了加密脱敏匿名化处理。
数据范围:
[30.727818,104.043333],[30.726490,104.129076],
[30.655191,104.129591],[30.652828,104.042102]
时间范围:2016年10月1日-10月31日
数据量:7.9G (压缩后)
数据格式 :tar.gz
数据库(集)组成: 数据包含轨迹数据,总共有31个文件。数据按照日期进行存储下载。
数据清单
1.1.4 2016年11月成都市二环局部区域轨迹数据
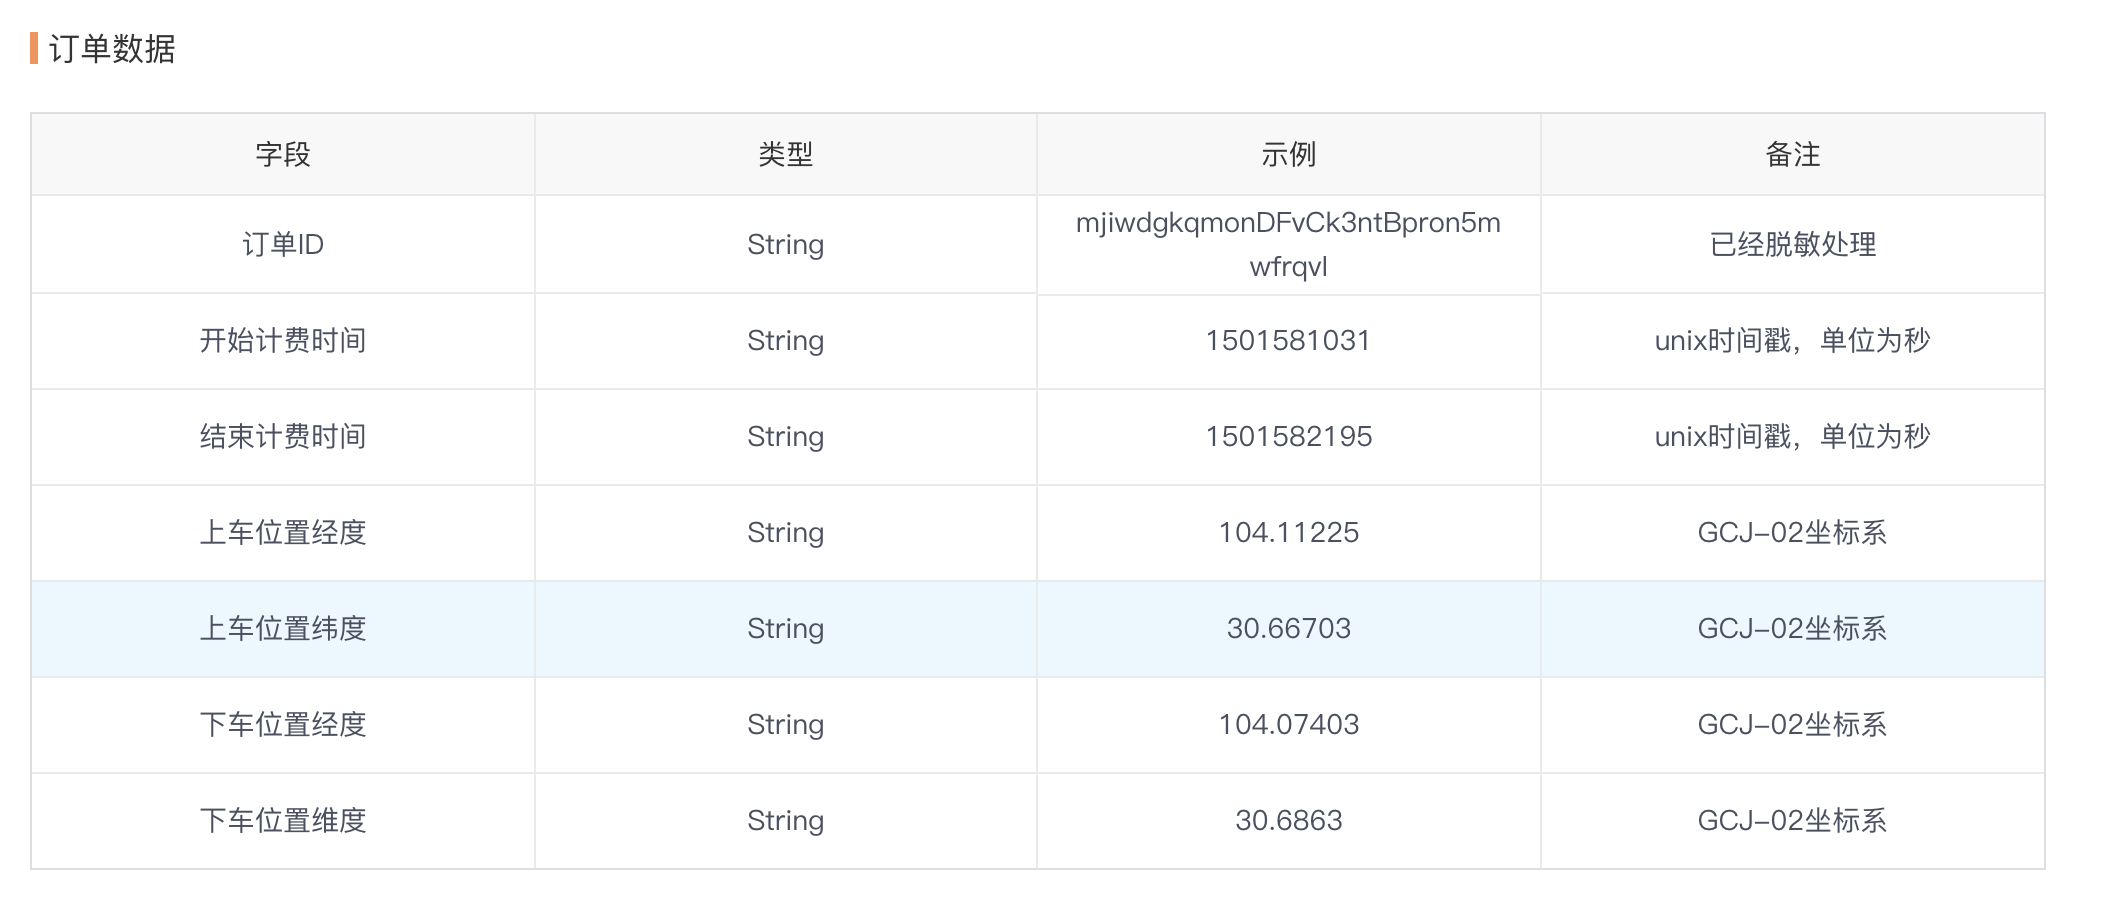
数据描述
向学界开放成都区域的滴滴全样本轨迹和订单数据。所有在数据范围内和日期范围内的轨迹数据,都将以2-4s的精度在数据中显示。订单数据将包括订单起止点坐标和起止点时间。
数据大小:原始数据约50G,压缩后约10G
数据范围: [30.727818,104.043333],[30.726490,104.129076]
[30.655191,104.129591],[30.652828,104.042102]
日期范围: 2016年11月1日至11月30日
数据清单
1.2 纽约市出租车行车位置记录(2013年)
数据描述
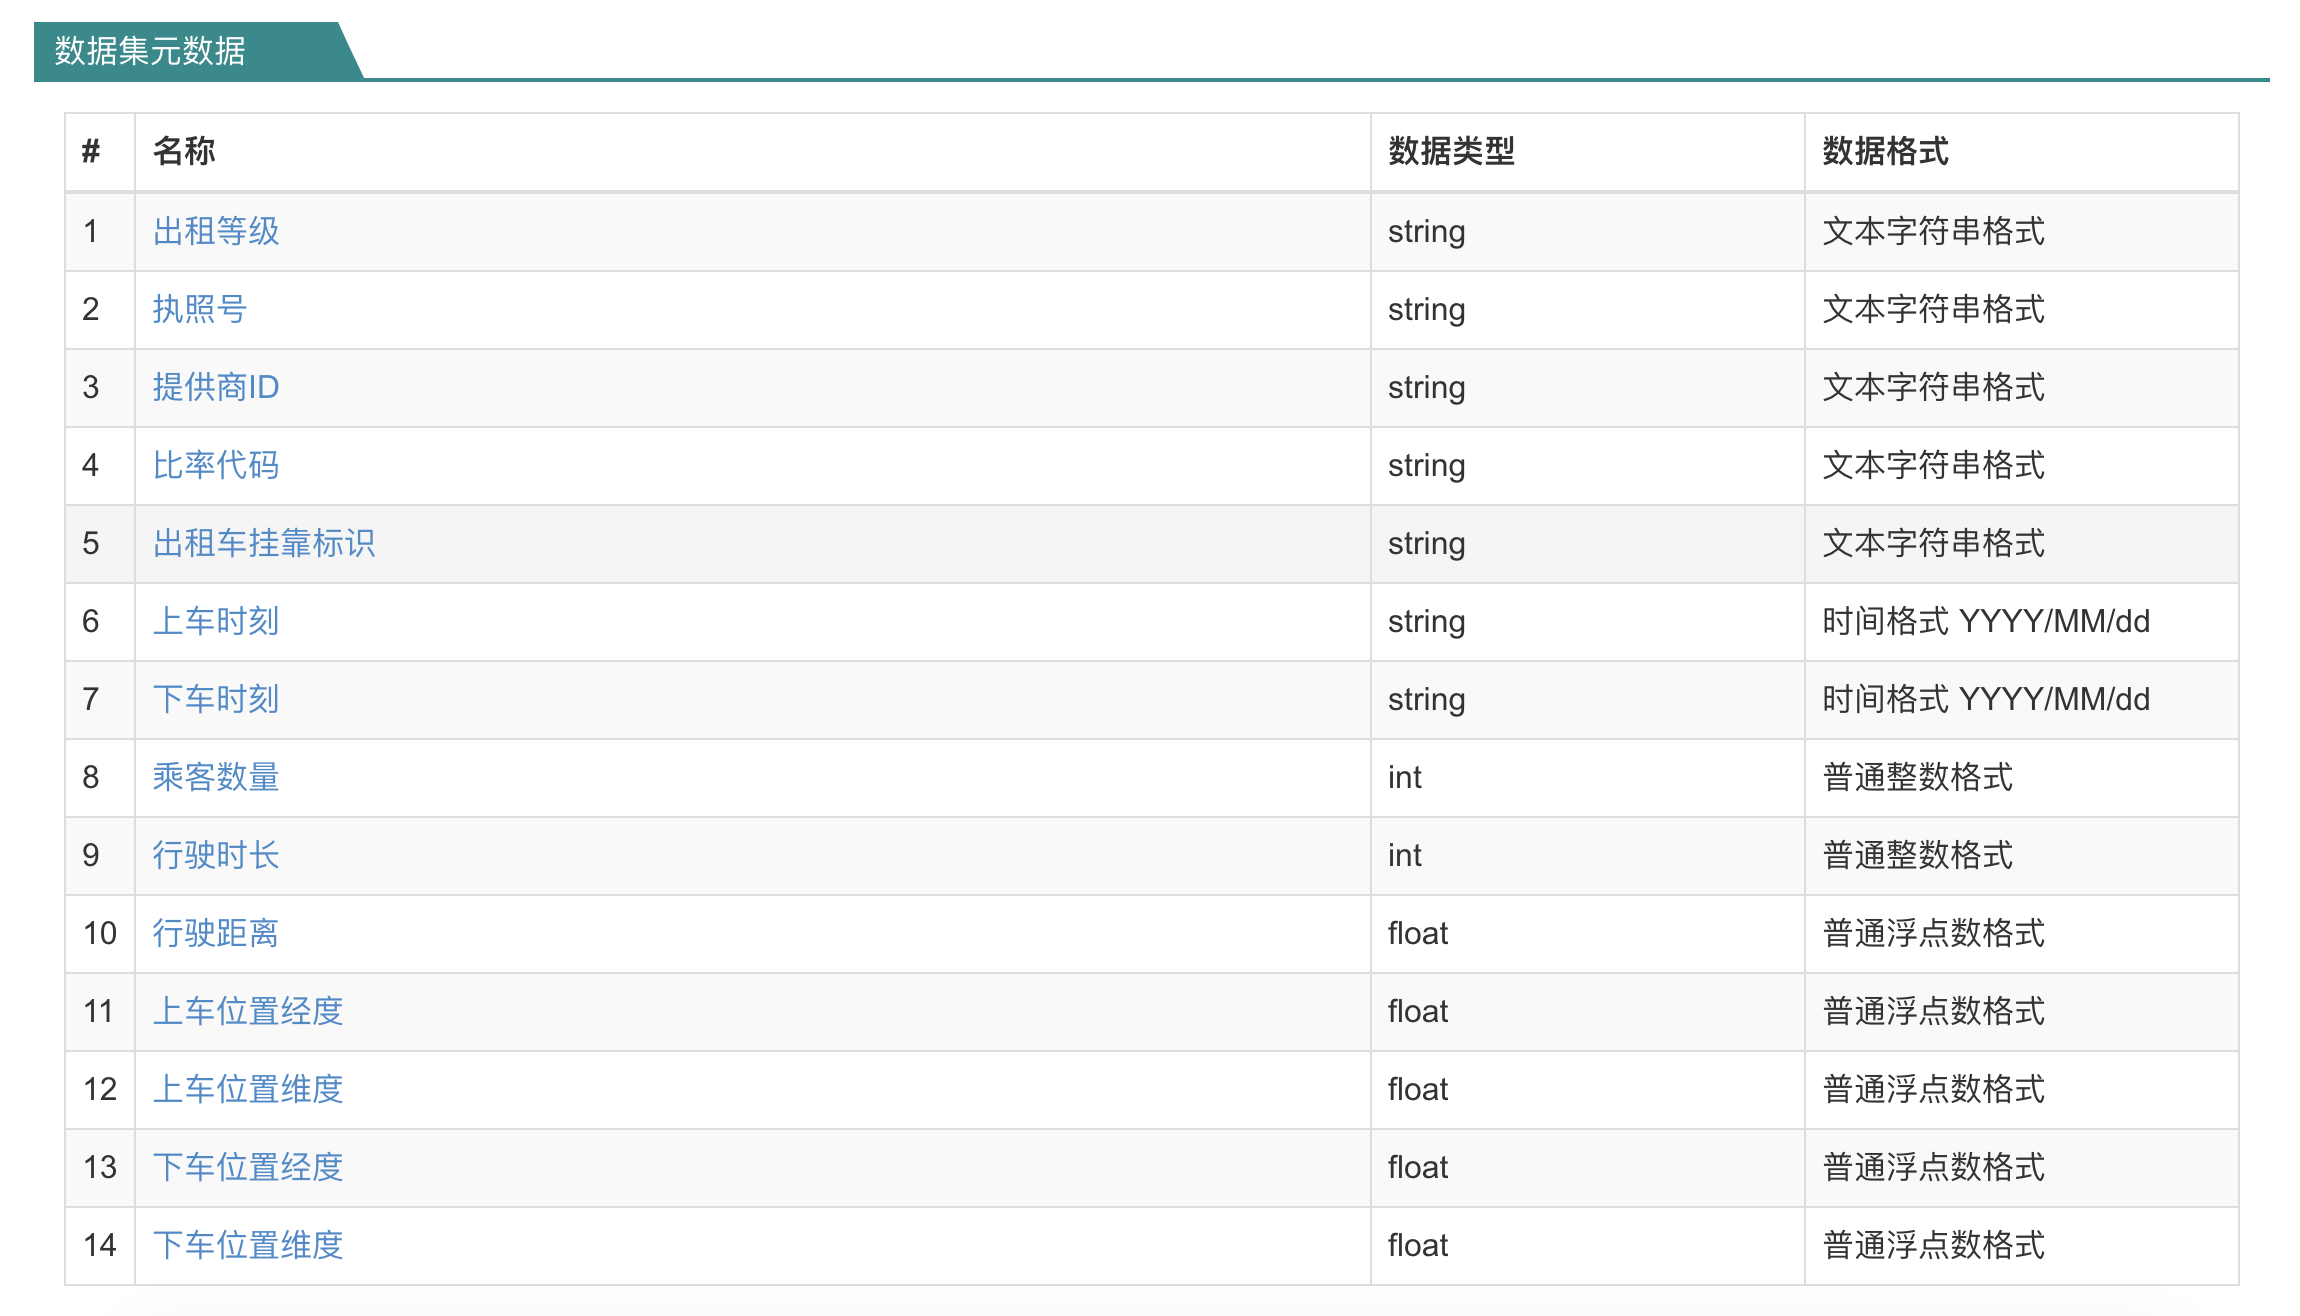
纽约市出租车行车位置记录(2013年),纽约市出租车的详细行车位置数据,包括 等级(medallion), 执照(hack license), 供应商编号(vendor id), 比率代码(rate code), (store and forward flag), 上车时间(pickup datetime), 下车时间(dropoff datetime), 乘客数量(passenger count), 行车时长(trip time in seconds), 行车距离(trip distance), 上车经纬度坐标(latitude and longitude coordinates for the pickup location) , 下车经纬度坐标( latitude and longitude coordinates for the dropoff location) 等属性信息。 该数据为个人根据 FOIL 法案从 NYC’s Taxi and Limousine Commission 处申请获得的数据。
数据清单
1.3 芝加哥出租车行驶记录(2013年至今)
数据描述
芝加哥市2013年至今的出租车载客行驶记录,包括,出租车ID、行程开始时间、行程结束时间、行程里程数、上下车乘客数、上下车社区区域。
http://digital.cityofchicago.org/index.php/chicago-taxi-data-released/
https://data.cityofchicago.org/Transportation/Taxi-Trips-Dashboard/spcw-brbq
https://data.cityofchicago.org/
1.4 纽约Uber 2014 & 2015接客数据
数据描述
数据包含Uber在美国纽约市的乘车记录,分为两段:2014年4月到9月之间,约450万项;2015年1月到6月间1430万项。另外包括10家租车公司行车级别的数据,和329家租车公司汇总级的数据。
This directory contains data on over 4.5 million Uber pickups in New York City from April to September 2014, and 14.3 million more Uber pickups from January to June 2015. Trip-level data on 10 other for-hire vehicle (FHV) companies, as well as aggregated data for 329 FHV companies, is also included. All the files are as they were received on August 3, Sept. 15 and Sept. 22, 2015.
FiveThirtyEight obtained the data from the NYC Taxi & Limousine Commission (TLC) by submitting a Freedom of Information Law request on July 20, 2015. The TLC has sent us the data in batches as it continues to review trip data Uber and other HFV companies have submitted to it. The TLC’s correspondence with FiveThirtyEight is included in the files TLC_letter.pdf, TLC_letter2.pdf and TLC_letter3.pdf. TLC records requests can be made here.
This data was used for four FiveThirtyEight stories: Uber Is Serving New York’s Outer Boroughs More Than Taxis Are, Public Transit Should Be Uber’s New Best Friend, Uber Is Taking Millions Of Manhattan Rides Away From Taxis, and Is Uber Making NYC Rush-Hour Traffic Worse?.
The dataset contains, roughly, four groups of files:
Uber trip data from 2014 (April - September), separated by month, with detailed location information
Uber trip data from 2015 (January - June), with less fine-grained location information
non-Uber FHV (For-Hire Vehicle) trips. The trip information varies by company, but can include day of trip, time of trip, pickup location, driver’s for-hire license number, and vehicle’s for-hire license number.
aggregate ride and vehicle statistics for all FHV companies (and, occasionally, for taxi companies)
数据清单
Uber trip data from 2014 There are six files of raw data on Uber pickups in New York City from April to September 2014. The files are separated by month and each has the following columns:
- Date/Time : The date and time of the Uber pickup
- Lat : The latitude of the Uber pickup
- Lon : The longitude of the Uber pickup
- Base : The TLC base company code affiliated with the Uber pickup
These files are named:
- uber-raw-data-apr14.csv
- uber-raw-data-aug14.csv
- uber-raw-data-jul14.csv
- uber-raw-data-jun14.csv
- uber-raw-data-may14.csv
- uber-raw-data-sep14.csv
- Uber trip data from 2015
Also included is the file uber-raw-data-janjune-15.csv This file has the following columns:
- Dispatching_base_num : The TLC base company code of the base that dispatched the Uber
- Pickup_date : The date and time of the Uber pickup
- Affiliated_base_num : The TLC base company code affiliated with the Uber pickup
- locationID : The pickup location ID affiliated with the Uber pickup 、 The Base codes are for the following Uber bases:
B02512 : Unter B02598 : Hinter B02617 : Weiter B02682 : Schmecken B02764 : Danach-NY B02765 : Grun B02835 : Dreist B02836 : Drinnen
For coarse-grained location information from these pickups, the file taxi-zone-lookup.csv shows the taxi Zone (essentially, neighborhood) and Borough for each locationID.
Non-Uber FLV trips
The dataset also contains 10 files of raw data on pickups from 10 for-hire vehicle (FHV) companies. The trip information varies by company, but can include day of trip, time of trip, pickup location, driver’s for-hire license number, and vehicle’s for-hire license number.
These files are named:
- American_B01362.csv
- Diplo_B01196.csv
- Highclass_B01717.csv
- Skyline_B00111.csv
- Carmel_B00256.csv
- Federal_02216.csv
- Lyft_B02510.csv
- Dial7_B00887.csv
- Firstclass_B01536.csv
- Prestige_B01338.csv
- Aggregate Statistics
There is also a file other-FHV-data-jan-aug-2015.csv containing daily pickup data for 329 FHV companies from January 2015 through August 2015.
The file Uber-Jan-Feb-FOIL.csv contains aggregated daily Uber trip statistics in January and February 2015.
1.5 英国车祸数据(2005-2015)
数据描述
UK police forces collect data on every vehicle collision in the uk on a form called Stats19. Data from this form ends up at the DfT and is published at https://data.gov.uk/dataset/road-accidents-safety-data
1.6 芝加哥汽车超速数据
数据描述
This dataset reflects the daily volume of speed violations that have been recorded by each camera installed in the City of Chicago as part of the Automated Speed Enforcement Program. The data reflects violations that occurred from July 1, 2014 until December 31, 2016. The reported violations were collected by the camera and radar system and reviewed by two separate city contractors. This dataset contains all violations regardless of whether a citation was issued.
1.7 芝加哥Divvy共享自行车骑行数据(2013年至今)
数据描述
芝加哥市Divvy共享自行车2013至今的骑行使用数据,包括使用者性别、年龄、每次旅行的起点,目的地和时间戳。 开始和结束时间、起点经纬度、重点经纬度等。
https://www.divvybikes.com/system-data
1.8 Capital 共享单车骑行数据
数据描述
Capital 共享单车骑行数据,包括:使用次数、骑行时间、骑行时长、起点和终点经纬度坐标等属性。
https://www.capitalbikeshare.com/system-data
1.9 Bay Area 共享单车骑行数据
数据描述
Bay Area Bike Share’s 共享单车骑行数据,包括:使用次数、骑行时间、骑行时长、起点和终点经纬度坐标等属性。
http://www.bayareabikeshare.com/open-data
1.10 Nice Ride 共享单车骑行数据
数据描述
Nice Ride 共享单车骑行数据,包括:使用次数、骑行时间、骑行时长、起点和终点经纬度坐标等属性。
https://www.niceridemn.org/data/
1.11 花旗银行共享单车骑行数据
数据描述
花旗银行共享单车骑行数据,包括:使用次数、骑行时间、骑行时长、起点和终点经纬度坐标等属性。
https://www.citibikenyc.com/system-data
1.12 运用卫星数据跟踪亚马逊热带雨林中的人类轨迹竞赛
数据描述
运用卫星数据跟踪亚马逊热带雨林中的人类轨迹竞赛
https://www.kaggle.com/c/planet-understanding-the-amazon-from-space
1.13 纽约出租车管理委员会官方的乘车数据(2009年-2016年)
数据描述
由纽约市政府中的出租车管理委员会提供的2009年到2016年,纽约出租车乘车记录数据。包括:乘车时间、上车经纬度、下车经纬度、乘客数量、车费等乘车信息。
http://www.nyc.gov/html/tlc/html/about/trip_record_data.shtml
2. 自动驾驶AI训练数据
2.1 Udacity 自动驾驶数据集
数据描述
Udacity 学城开放的自动驾驶课程中的自动驾驶汽车数据集,旨在打造一个开源的自动驾驶项目。
https://www.udacity.com/self-driving-car
2.2 KITTI 自动驾驶数据
数据描述
KITTI是一系列以自动驾驶为目标的机器视觉任务数据,包括:空间建模、视觉流、视觉测距、3D物体检测、3D物体追踪等。数据来自一辆搭载2台彩色和黑白摄像机、360度激光雷达和GPS定位系统的小汽车,在中等规模城市Karlsruhe行驶并记录数据。
http://www.cvlibs.net/datasets/kitti/
2.3 Cityscapes 场景标注数据
数据描述
Cityscapes数据集则是由奔驰主推,提供无人驾驶环境下的图像分割数据集。用于评估视觉算法在城区场景语义理解方面的性能。Cityscapes包含50个城市不同场景、不同背景、不同季节的街景,提供5000张精细标注的图像、20000张粗略标注的图像、30类标注物体。用PASCAL VOC标准的 intersection-over-union (IoU)得分来对算法性能进行评价。 Cityscapes数据集共有fine和coarse两套评测标准,前者提供5000张精细标注的图像,后者提供5000张精细标注外加20000张粗糙标注的图像。
2.4 德国交通标志识别数据
数据描述
German Traffic Sign Recognition Benchmark (GTSRB) 是一个德国交通标志检测数据,通过模式识别技术辅助驾驶员进行交通标识识别。包括以下几个方面:
单图像检测
900个图像 (分为600个训练图像和300个评估图像)
划分为适合不同性质的各种检测方法的性质的三个类别
一个可以立即分析并能排序提交的结果的在线评估系统
http://benchmark.ini.rub.de
2.5 TLR 交通信号识别视频数据
数据描述
Traffic Lights Recognition (TLR) 是一个交通信号灯识别的视频数据,在真实的道路上采集的交通信号灯视频,分辨率为 640x480,由法国一所大学提供。
http://www.lara.prd.fr/benchmarks/trafficlightsrecognition
3. Point of Interest (POI) Data
4. Social Media with Geo-Tag
4.1 Weibo
5. House Price
6. Environment
数据总结及问题
- 目前的数据多是问卷数据。
汽车保险数据
自动驾驶图片/视频数据集
网上关于自动驾驶的言论
房价数据
汽车保险数据