2018.10 Paper
Bonnefon J F, Shariff A, Rahwan I. The social dilemma of autonomous vehicles[J]. Science, 2016, 352(6293): 1573-1576.
Motivation
AVs will sometimes have to choose between two evils, such as running over pedestrians or sacrificing themselves and their passenger to save the pedestrians. Defining the algorithms that will help AVs make these moral decisions is a formidable challenge.
Manufacturers and regulators will need to accomplish three potentially incompatible objectives: being consistent, not causing public outrage, and not discouraging buyers.
Research Question
What is the moral algorithms that we are willing to accept as citizens and to be subjected to as car owners ?
Model
Survey: six Amazon Mechanical Turk studies (n = 1928 total participants, U.S. residents only) between June and November 2015.
Studies described in the experimental ethics literature largely rely on MTurk respondents, with robust results, even though MTurk respondents are not necessarily representative of the U.S. population (13, 14).
In study one (n = 182 participants), 76% of participants thought that it would be more moral for AVs to sacrifice one passenger rather than kill 10 pedestrians [with a 95% confidence interval (CI) of 69 to 82].
In study two (n = 451 participants), participants were presented with dilemmas that varied the number of pedestrians’ lives that could be saved, from 1 to 100. Participants did not think that AVs should sacrifice their passenger when only one pedestrian could be saved (with an average approval rate of 23%), but their moral approval increased with the number of lives that could be saved (P < 0.001), up to approval rates consistent with the 76% observed in study one (Fig. 2B)
In study three presentsthe first hintofasocial dilemma. On a scale of 1 to 100, respondents were asked to indicate how likely they would be to buy an AVprogrammed tominimize casualties (which would, in these circumstances, sacrifice them and their co-rider family member), as well as how likely they would be to buy an AV programmed to prioritize protecting its passengers, even if it meant killing 10 or 20 pedestrians. Although the reported likelihood of buying an AV was low even for the self-protective option (median = 50), respondents indicated a significantly lower likelihood (P <0.001) of buying the AV when they imagined the situation in which they and their family member would be sacrificed for the greater good (median = 19). In other words, even though participants still agreed that utilitarian AVs were themostmoral, theypreferred the self-protective model for themselves.
In study four (n = 267 participants) offers another demonstration of this phenomenon. Participants were given 100 points to allocate between different types ofalgorithms, to indicate (i) howmoral the algorithms were, (ii) how comfortable par- ticipants were for other AVs to be programmed in a given manner, and (iii) how likely participants would be to buy an AV programmed in a given manner.
In study five(n = 376 participants), we asked participants about their attitudes toward legally enforcing utilitarian sacrifices. Participants con- sidered scenarios in which either a human driver or a control algorithm had anopportunity to self- sacrificetosave1or 10 pedestrians(Fig. 3C). As usual, the perceived morality of the sacrifice was high and about the same whether the sacrifice was performed by a human or by an algorithm (median = 70). When we inquired whether partic- ipants would agree to see such moral sacrifices legally enforced, their agreement was higher for algorithms than for human drivers (P<0.002), but the average agreement still remained below the midpoint of the 0 to 100 scale in each scenario. Agreement was highest in the scenario in which algorithms saved 10 lives,witha 95%CI of 33 to 46.
In study six (n = 393 participants), we asked participants specifically about their likeli- hood ofpurchasing theAVswhose algorithmshad been regulated by the government. people were reluctant to accept governmental regulation of utilitarian AVs. Even in the most favorable condition, when participants imagined only them- selves being sacrificed to save 10 pedestrians, the 95% CI for whether people thought it was appro- priate for the government to regulate this sacri- fice was only 36 to 48. Finally,
Result
Participants in six Amazon Mechanical Turk studies approved of utilitarian AVs (that is, AVs that sacrifice their passengers for the greater good) and would like others to buy them, but they would themselves prefer to ride in AVs that protect their passengers at all costs.
The study participants disapprove of enforcing utilitarian regulations for AVs and would be less willing to buy such an AV.
Contribution
Three groups may be able to decide how AVs handle ethical dilemmas: the consumers who buy the AVs; the manufacturers that program the AVs; and the government, which may regulate the kind ofprogrammingmanufacturers canoffer and consumers can select.
Our findings suggest that regulation for AVs maybe necessarybut also counterproductive.Mor- al algorithms for AVs create a social dilemma (18, 19). Although people tend to agree that every- one would be better off ifAVs were utilitarian (in the sense ofminimizing the number ofcasualties on the road), these same people have a personal incentive to ride in AVs that will protect them at allcosts.Accordingly,if bothself-protective and utilitarian AVs were allowed on the market, few people would bewilling to ride in utilitarian AVs, even though they would prefer others to do so. Regulation may provide a solution to this problem, but regulators will be faced with two diffi- culties: First, most people seem to disapprove of a regulation that would enforce utilitarian AVs. Second—and amore serious problem—our results suggest that such regulation could substantially delay the adoption of AVs, which means that the lives saved by making AVs utilitarian may be outnumbered by the deaths caused by delaying the adoption ofAVs altogether. Thus, car-makers and regulators alike should be considering solu- tions to these obstacles.
Figuring out how to build ethical autonomous machines is one of the thorniest challenges in ar- tificial intelligence today (22).
Thornton S M, Pan S, Erlien S M, et al. Incorporating ethical considerations into automated vehicle control[J]. IEEE Transactions on Intelligent Transportation Systems, 2017, 18(6): 1429-1439.
Motivation
Not only do automated vehicles need to meet specifications for technical performance, they also need to satisfy the societal expectations for behavior in traffic with humans. Societal expectations, such as accident avoidance and adherence to traffic laws, have their foundation in core moral issues found in philosophy and ethics. Engineers designing control algorithms for automated vehicles can benefit from applying principles and frameworks from philosophy to drive design decisions.
Research Question
Our ultimate goal is to use ethical principles to make engineering decisions that result in reasonable, justifiable automated vehicle behavior.
To the knowledge of the authors, this is the first quantitative and in-vehicle experimental endeavor to incorporate ethics in the design of autonomous vehicle control.
Model
Scenario
we construct a simple, realistic driving scenario that involves a variety of factors, including collision avoidance, mobility considerations and traffic laws.
The scope of engineering decisions that must be determined does not merely lie in the type of action to take; the degree of the action needs to be assessed too.
Philosophical frameworks
Deontology is one of the major normative ethical theories. Deontological ethics follow a set of rules that determine the correct, ethical action, and these rules are to be followed with no exception. Isaac Asimov’s Three Laws of Robotics [21] are an example of deontological ethics
Deontology provides one type of motivating structure for the programming of automated vehicle algorithms: rules that can be defined and followed on the road.
A key feature of a deontological framework is that rules can be hierarchical, thus setting clear priorities.
Another central normative ethical theory is consequentialism, which evaluates the moral validity of actions solely based on their consequences. We focus on a form of consequen- tialism known as utilitarianism, which analyzes the expected utility of a scenario and evaluates the consequences of actions based on what produces the most good [22]. The guiding principle is to always achieve the best outcome, i.e., “the ends justify the means.”
Consequentialism, through its more specific form of utilitarianism, provides a basis for casting ethical decision making as an optimization problem.
This approach also has some limitations, such as the difficulty in actually forming or evaluating the cost function (as is the case with definitions such as “harm” [12]) or making that cost function comprehensive (by, for instance, considering road users other than the occupants in this case).
Design choices
In this paper, we adopt an MPC formulation of the problem since the explicit consideration of constraints and costs in MPC maps well to the concepts of deontology and consequentialism. TheIn this paper, we adopt an MPC formulation of the problem since the explicit consideration of constraints and costs in MPC maps well to the concepts of deontology and consequentialism.
A. Path Tracking
following the path is not a strict requirement when it comes to maintaining safety; if an obstacle appears in the path, then the vehicle should have the option to deviate.
B. Steering
The vehicle steering encompasses a few different design goals. The steering must operate within the actuator limits, should contribute toward path tracking and obstacle avoidance, and should perform smoothly.
C. Obstacle Avoidance
D. Traffic Laws Traffic
Traffic laws present the most ambiguous choice between rule- and cost-based design.
we use a set of ethical frameworks to map design decisions for a model predictive control problem to philosophical principles. Deontology, a rule-based ethical framework, motivates the development of constraints on the system. Consequentialism, a cost-based ethical framework, motivates the construction of the objective function. The choice of weights is guided by the concepts of virtue ethics and role morality to determine behavior for different types of vehicles.
Contribution
The normative ethical theories of deontology and con- sequentialism provide guiding principles for responsible programming of autonomous vehicles. In particular, these concepts map well to an MPC framework which minimizes the consequential costs subject to deontological constraints. Making these connections can enable engineers working at the deepest levels of programming automated vehicles to connect their design choices with broader issues of societal acceptance. This paper has examined how to incorporate objectives such as path tracking, vehicle occupant comfort, and traffic laws as priorities in the cost function together while obstacle avoidance and vehicle slew rate limits enter as constraints. The concept of role morality provides a further basis for different weighting schemes within the control formulation depending on the vehicle type and function.
Fagnant D J, Kockelman K. Preparing a nation for autonomous vehicles: opportunities, barriers and policy recommendations[J]. Transportation Research Part A: Policy and Practice, 2015, 77: 167-181.
Motivation
Autonomous vehicles (AVs) represent a potentially disruptive yet beneficial change to our transportation system. This new technology has the potential to impact vehicle safety, con- gestion, and travel behavior. All told, major social AV impacts in the form of crash savings, travel time reduction, fuel efficiency and parking benefits are estimated to approach $2000 to per year per AV, and may eventually approach nearly $4000 when comprehensive crash costs are accounted for. Yet barriers to implementation and mass-market penetration remain. Initial costs will likely be unaffordable. Licensing and testing standards in the U.S. are being developed at the state level, rather than nationally, which may lead to incon- sistencies across states. Liability details remain undefined, security concerns linger, and without new privacy standards, a default lack of privacy for personal travel may become the norm. The impacts and interactions with other components of the transportation system, as well as implementation details, remain uncertain. To address these concerns, the federal government should expand research in these areas and create a nationally recognized licensing framework for AVs, determining appropriate standards for liability, security, and data privacy.
Research question
This paper serves as an introduction to AV technology, its potential impacts, and hurdles for transportation professionals and policymakers.
This paper seeks to explore the feasible aspects of AVs and discuss their potential impacts on the transportation system. This research explores the remaining barriers to well-managed, large-scale AV market penetration and suggests federal-level policy recommendations for an intelligently planned transition, as AVs become a growing share of our transportation system. The paper contains three major sections:
- Potential benefits of autonomous vehicles.
- Barriers to implementation.
- Policy recommendations.
Potential impacts of autonomous vehicles
1. Safety
Over 40% of these fatal crashes involve some combination of alcohol, distraction, drug involvement and/or fatigue.1 Self-driven vehicles would not fall prey to human failings, suggesting the potential for at least a 40% fatal crash-rate reduction, assuming automated malfunctions are minimal and everything else remains constant (such as the levels of long-distance, night-time and poor-weather driving).
自动驾驶虽然减小了因为人类司机失误带来的事故,但是是否可能带来其他事故?例如黑客问题。
computer vision has much greater difficulty than humans in identifying material composition.
2. Congestion and traffic operations
As the research shows, these benefits will not happen automatically. Many of these congestion-saving improvements depend not only on automated driving capabilities, but also on cooperative abilities through vehicle-to-vehicle (V2V) and vehicle-to-infrastructure (V2I) communication.
车辆之间的合作将由谁来主导?
Even without V2X communication, significant congestion reduction could occur if the safety benefits alone are realized. FHWA estimates that 25% of congestion is attributable to traffic incidents, around half of which are crashes (Federal Highway Administration, 2005).
3. Travel-behavior impacts
AVs may provide mobility for those too young to drive, the elderly and the disabled, thus generating new roadway capacity demands.
Most of these ideas point toward more vehicle-miles traveled (VMT) and automobile-oriented development, though perhaps with fewer vehicles and parking spaces.
4. Freight transportation
Freight transport on and off the road will also be impacted. As one example, mining company Rio Tinto is already using 53 self-driving ore trucks, having driven 2.4 million miles and carrying 200 million tons of materials (Rio Tinto, 2014)
5. Anticipating AV impacts
To further understand the impact, the analysis assumes three AV market-penetration shares: 10%, 50% and 90%. These are assumed to represent not only market shares, but technological improvements over time, since it could take many years for the U.S. to see high penetration rates. This analysis is inherently imprecise, it provides an order-of-magnitude estimate of the broad economic and safety impacts this technology may have.
6. Changes in VMT and vehicle ownership
VMT per AV is assumed to be 20% higher than that of non-AV vehicles at the 10% market penetration rate, and 10% higher at the 90% market penetration rate.
7. discount rate and technology costs
Early-introduction costs (perhaps seven years after initial roll- out) at the 10% market penetration level were assumed to add $10,000 to the purchase price of a new vehicle, falling to $3000 by the 90% market-penetration share, consistent with the findings noted in the Vehicle Cost section of this paper. Discussion
8. Safety impacts
9. Congestion reduction
10. Parking
Barriers to implementation
1. Vehicle costs
2. AV certification
3. Litigation, liability and perception
4. Security
5. Privacy
6. Missing research
While AVs may be commercially available within five years, related research lags in many regards. Much of this is due to the uncertainty inherent in new contexts: with the exception of a few test vehicles, AVs are not yet present in traffic streams and it is difficult to reliably predict the future following such disruptive paradigm shifts. Moreover, technical developments along with relevant policy actions, will effect outcomes and create greater uncertainty. With these caveats in mind, it is use- ful to identify the critical gaps in existing investigations to better prepare for AVs’ arrival.
One of the most pressing needs is a comprehensive market penetration evaluation. As KPMG and CAR (2012), Google (O’Brien, 2012), Nissan (Nissan, 2013), Volvo (Carter, 2012), and others make clear, AVs probably will be driving on our streets and highways within the next decade, but it is uncertain when they will comprise a substantial share of the U.S. fleet. More meaningful market penetration estimates should attach dates and percentages to aggressive, likely, and conservative AV-adoption scenarios. This would provide transportation planners and policy-makers with a reasonable range of outcomes for evaluating competing infrastructure investments, AV policies, and other decisions.
Other important research gaps have been identified, with broad topic areas outlined at the 2014 Automated Vehicles Symposium (Transportation Research Board, 2014), as follows:
- Automated transit and shared mobility.
- Regional planning and modeling.
- Roadway management and operations.
- Truck automation opportunities.
- Legal accelerators and brakes.
- Automated vehicle human factors.
- Near-term deployment opportunities.
- Personal vehicle automation commercialization.
- Automation systems operational requirements.
- Road infrastructure needs of connected-automated vehicles.
Policy recommendations
1. Expand federal funding for autonomous vehicle research
2. Develop federal guidelines for autonomous vehicle certification
3. Determine appropriate standards for liability, security, and data privacy
Kalra N, Paddock S M. Driving to safety: How many miles of driving would it take to demonstrate autonomous vehicle reliability?[J]. Transportation Research Part A: Policy and Practice, 2016, 94: 182-193.
Motivation
How safe are autonomous vehicles? The answer is critical for determining how autono- mous vehicles may shape motor vehicle safety and public health, and for developing sound policies to govern their deployment.
Research question
How safe should autonomous vehicles be before they are allowed on the road for consumer use? For the answer to be mean- ingful, however, one must also be able to address a second concern: How safe are autonomous vehicles?
In this report, we answer the next logical question: How many miles would be enough? In particular, we first ask:
- How many miles would autonomous vehicles have to be driven without failure to demonstrate that their failure rate is below some benchmark? This provides a lower bound on the miles that are needed.
However, autonomous vehicles will not be perfect and failures will occur. Given imperfect performance, we next ask:
-
How many miles would autonomous vehicles have to be driven to demonstrate their failure rate to a particular degree of precision?
-
How many miles would autonomous vehicles have to be driven to demonstrate that their failure rate is statistically significantly lower than the human driver failure rate?
Model
In this paper, we calculate the number of miles of driving that would be needed to provide clear statistical evidence of autonomous vehicle safety
- How many miles would autonomous vehicles have to be driven without failure to demonstrate that their failure rate is below some benchmark?
To demonstrate that fully autonomous vehicles have a fatality rate of 1.09 fatalities per 100 million miles (R = 99.9999989%) with a C= 95% confidence level, the vehicles would have to be driven 275 million failure-free miles. With a fleet of 100 autonomous vehicles being test-driven 24 h a day, 365 days a year at an average speed of 25 miles per hour, this would take about 12.5 years.
This analysis shows that for fatalities it is not possible to test-drive autonomous vehicles to demonstrate their safety to any plausible standard, even if we assume perfect performance. In contrast, one could demonstrate injury and crash reliability to acceptable standards based on driving vehicles a few million miles. However, it is important to recognize that this is a theoretical lower bound, based on perfect performance of vehicles. In reality, autonomous vehicles will have fail- ures—not only commonly occurring injuries and crashes in which autonomous vehicles have already been involved, but also fatalities. Our second and third questions quantify the miles needed to demonstrate reliability through driving given this reality.
- How many miles would autonomous vehicles have to be driven to demonstrate their failure rate to a particular degree of precision?
We can demonstrate this as follows. Given some initial data on its safety performance, suppose we assume that a fully autonomous vehicle fleet had a true fatality rate of 1.09 per 100 million miles. We could use this information to determine the sample size (number of miles) required to estimate the fatality rate of the fleet to within 20% of the assumed rate using a 95% CI. This is approximately 8.8 billion miles. With a fleet of 100 autonomous vehicles being test-driven 24 h a day, 365 days a year at an average speed of 25 miles per hour, this would take about 400 years.
These results show that it may be impossible to demonstrate the reliability of high-performing autonomous vehicles (i.e., ones with failure rates comparable to or better than human failure rates) to any reasonable degree of precision. For instance, even if the safety of autonomous vehicles is low—hundreds of failures per 100 million miles, which is akin to human-driven injury and crash rates—demonstrating this would take tens or even hundreds of millions of miles, depending on the desired precision. For low failure rates—1 per 100 million miles, which is akin to the human-driven fatality rate—demonstrating per- formance to any degree of precision is impossible—requiring billions to hundreds of billions of miles. These results show that as autonomous vehicles perform better, it becomes harder—if not impossible—to assess their performance with accuracy because of the extreme rarity of failure events.
- How many miles would autonomous vehicles have to be driven to demonstrate that their failure rate is statistically significantly lower than the human driver failure rate?
It would take approximately 5 billion miles to demonstrate this difference. With a fleet of 100 autonomous vehicles test- driven 24 h a day, 365 days a year at an average speed of 25 miles per hour, this would take about 225 years.
Yet even these results are optimistic. We have intentionally framed this analysis to calculate the fewest number of miles that would need to be driven to demonstrate statistically significant differences between autonomous vehicles and human drivers. First, developers are likely to improve autonomous vehicles as testing reveals shortcomings of the technology. The performance of the vehicle will change between the start and the end of a multiyear testing time frame, hopefully for the better. However, this may mean that still more miles are required to prove safety because the technology will have changed.
Second, recall that we treat H as a known benchmark against which we can do a one-sample test. Yet H is not a known benchmark for three key reasons. First, the performance of human drivers in 2013 or any particular year is not the bench- mark of concern. The concern is whether autonomous vehicle performance is better than human driver performance, and a single year’s failure data is only an estimate of the true rate of human driver failures. Second, injuries and crashes are sig- nificantly underreported and there is conflicting evidence about the rate of underreporting. Experiments in which injuries and crashes are accurately recorded could yield different rates. Third, human driver performance is changing. Motor vehicle fatality rates have fallen in the past several decades. In 1994, there were 1.73 fatalities per 100 million miles compared with 1.09 fatalities per 100 million miles in 2013 (Bureau of Transportation Statistics, 2015). Much of the decline can be attributed to improvements in vehicle designs (Farmer and Lund, 2015), which could continue. Thus, the benchmark of human driver performance is a moving target. So, if we compare the performance of human drivers against autonomous vehicles in some time frame, there is uncertainty about whether the comparison would hold moving into the future. For all of these reasons, it would be appropriate to treat H as uncertain and use a two-sample hypothesis test, which would require even more failures to be observed and miles to be driven. This suggests it is not possible to drive our way to answers to one of the most impor- tant policy questions about autonomous vehicles: Are they safer than human drivers?
Result
we show that fully autonomous vehicles would have to be driven hundreds of millions of miles and sometimes hundreds of billions of miles to demonstrate their reliability in terms of fatalities and injuries
Contribution
These findings demonstrate that developers of this technology and third-party testers cannot simply drive their way to safety. Instead, they will need to develop innovative methods of demonstrat- ing safety and reliability. And yet, the possibility remains that it will not be possible to establish with certainty the safety of autonomous vehicles. Uncertainty will remain. Therefore, it is imperative that autonomous vehicle regulations are adaptive—designed from the outset to evolve with the technology so that society can better harness the ben- efits and manage the risks of these rapidly evolving and potentially transformative technologies.
Daziano R A, Sarrias M, Leard B. Are consumers willing to pay to let cars drive for them? Analyzing response to autonomous vehicles[J]. Transportation Research Part C: Emerging Technologies, 2017, 78: 150-164.
Motivation
little attention has been devoted to the analysis of automated vehicles as marketable products. Consumer acceptance is critical to forecast adoption rates, espe- cially if one considers that there may be strong barriers to entry (potential high costs, concerns that technology may fail).
Research question
In this paper we derive semiparametric estimates of the willingness to pay for automation. We
Model
Data
We use data from a nationwide online panel of 1260 individuals who answered a vehicle-purchase dis- crete choice experiment focused on energy efficiency and autonomous features.
Method
We designed a web-based survey with a discrete choice experiment to determine early-market empirical estimates of the structural parameters that characterize current preferences for autonomous and semi-autonomous electric vehicles. The discrete choice experiment contained as experimental attributes three levels of automation: no automation, some or partial automation (‘‘automated crash avoidance”), and full automation (‘‘Google car”). Automation was allowed for alternative powertrains (hybrid electric, plug-in hybrid and full battery electric). Based on the results from this experiment, we estimate WTP for automation.
Results
We draw three key results from our analysis.
First, we find that the average household is willing to pay a significant amount for automation: about $3500 for partial automation and $4900 for full automation.
Second, we estimate substantial heterogeneity in preferences for automation, where a significant share of the sample is willing to pay above $10,000 for full automation technology while many are not willing to pay any positive amount for the technology.
Third, our semiparametric random parameter logit estimates suggest that the demand for automation is split approximately evenly between high, modest and no demand, highlighting the importance of modeling flexible preferences for emerging vehicle technology.
A paper related to our own is that by Bansal et al. (2016), which estimates willingness to pay for different levels of automation. They find that for their sample of 347 residents of Austin, Texas, willingness to pay (WTP) for full automation is $7253, which is substantially higher than our own estimate. The authors also estimate WTP for partial automation of $3300, which is similar to our estimate.
Contribution
Our work contributes to two strands of literature on the demand for new technology. The first area is the recent development in understanding the demand, penetration, and policy implications of autonomous vehicle technology. Our demand estimates contribute to the assessment of the social costs and benefits of autonomous vehicles. Fagnant
Bansal P, Kockelman K M. Forecasting Americans’ long-term adoption of connected and autonomous vehicle technologies[J]. Transportation Research Part A: Policy and Practice, 2017, 95: 49-63.
Motivation
Automobile manufacturers, transportation researchers, and policymakers are interested in knowing the future of connected and autonomous vehicles (CAVs). Despite the excitement about CAVs, there is much uncertainty regarding their future. Policymakers,
Research question
forecast Americans’ long- term (year 2015–2045) adoption levels of CAV technologies.
Model
this study proposes a new simulation-based fleet evolution framework to forecast Americans’ long- term (year 2015–2045) adoption levels of CAV technologies under eight different scenarios based on 5% and 10% annual drops in technology prices; 0%, 5%, and 10% annual increments in Americans’ willingness to pay (WTP); and changes in government regulations (e.g., mandatory adoption of connectivity on new vehicles). This simulation was calibrated with data obtained from a survey of 2167 Americans, regarding their preferences for CAV tech- nologies (e.g., WTP) and their household’s annual vehicle transaction decisions
Result
Long-term fleet evolution suggests that the privately held light-duty-vehicle fleet will have 24.8% Level 4 AV penetration by 2045 if one assumes an annual 5% price drop and constant WTP values (from 2015 forward). This share jumps to 87.2% if one uses a 10% annual rate of decline in prices and a 10% annual rise in WTP values. Overall, simulations suggest that, without a rise in most people’s WTP, or policies that promote or require tech- nologies, or unusually rapid reductions in technology costs, it is unlikely that the U.S. light- duty vehicle fleet’s technology mix will be anywhere near homogeneous by the year 2045
Other useful opinions
SAVs are likely to change future vehicle ownership patterns (Fagnant et al., 2015) and thus, inclusion of them in the simulation framework could be a good extension of this study.
Ohn-Bar E, Trivedi M M. Looking at humans in the age of self-driving and highly automated vehicles[J]. IEEE Transactions on Intelligent Vehicles, 2016, 1(1): 90-104.
Motivation
The aim of this work is to recognize the next set of research challenges required to be addressed for achieving highly reliable, fail-safe, intelligent vehicles which can earn the trust of humans who would ultimately purchase and use these vehicles.
Research question
This paper follows three main domains where humans and highly automated or self-driving vehicles interact (illustrated in Fig. 1):
(1) Humans in vehicle cabin
(2) Humans around the vehicle
(3) Humans in surrounding vehicles
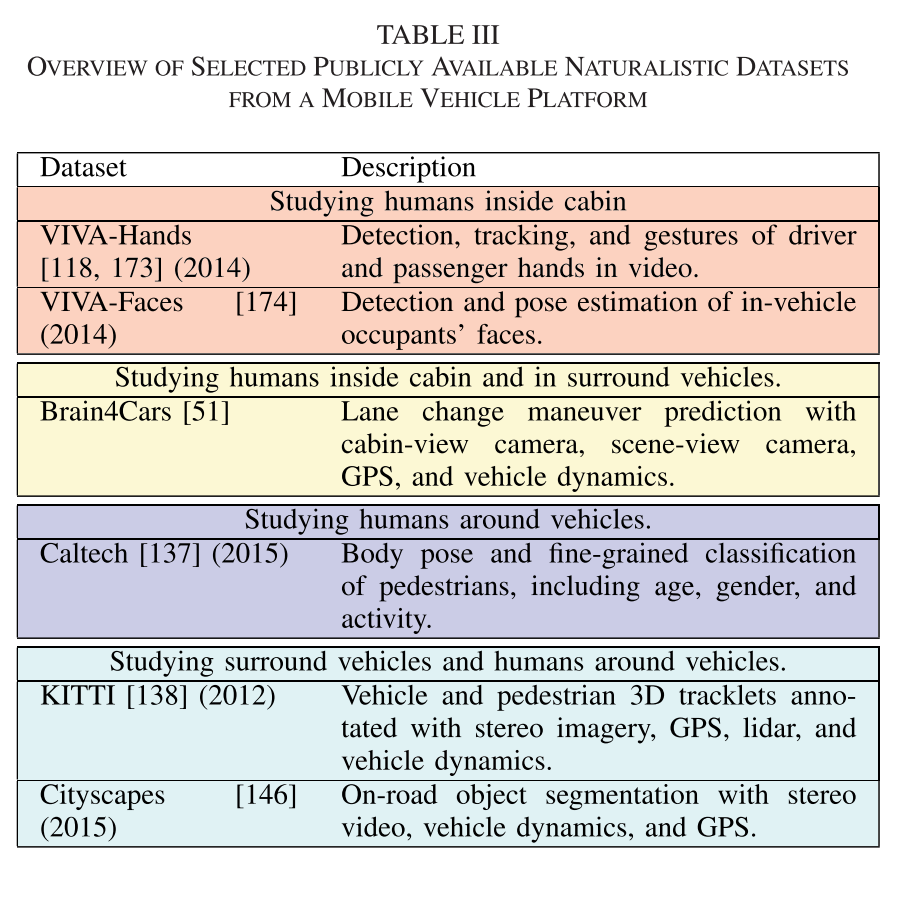
LOOKING AT HUMANS IN AND AROUND THE VEHICLE: RESEARCH LANDSCAPE AND ACCOMPLISHMENTS
- Domain clustering: humans inside the vehicle, around, and in surrounding ve- hicles.
- Research goal clustering: prediction (what will happen next?), attention model (where and what is the focus of the agent?), skill and style (what type of agent?), alertness and distraction (what is the state of the agent?), and general activity classification and behavior analysis (how is the agent operating?). autonomy handover and privacy-related tasks.
- Cue type analysis: direct human-observing cues (e.g. body pose) and indirect cues (e.g. vehicle dynamics, GPS).
Emerging research topics for studying humans inside the vehicle:
(a) Gaze zone classification using head cues;

(b) Object interaction analysis and secondary task classification with hand cues;

(c) Head, hand, and eye cue integration for secondary task activity analysis;

(d) Cabin occupant activity and interaction analysis.
Emerging research topics for studying people around the vehicle.
(a) Pedestrian body pose and attribute classification;

(b) Pedestrian path and intent prediction;

(c) Fine-grained pedestrain activity classification;

(d) Social relationships modeling.
Understanding activity and modeling intent of other vehicles is widely researched for path prediction and activity classification.
NATURALISTIC DATASETS AND ANALYSIS TOOLS
A. Towards Privacy Protecting Safety Systems
Privacy preserving considerations may play a role in the con- struction of publicly available large-scale datasets, especially as current state-of-the-art algorithms for intelligent vehicles re- quire large amounts of data for training and evaluation. There- fore, as a community, it is important to raise the standards ofboth safety and security in the development on intelligent vehicles.
B. Naturalistic Driving Datasets
Wang Y, Xu W. Leveraging deep learning with LDA-based text analytics to detect automobile insurance fraud[J]. Decision Support Systems, 2018, 105: 87-95.
Motivation
Automobile insurance fraud represents a pivotal percentage of property insurance companies’ costs and affects the companies’ pricing strategies and social economic benefits in the long term. Automobile insurance fraud detection has become critically important for reducing the costs of insurance companies.
Previous studies on automobile insurance fraud detection examined various numeric factors, such as the time ofthe claimand the brand ofthe insured car. However, the textual information in the claims has rarely been studied to analyze insurance fraud.
Some useful background
Mainly responsible for vari- ous losses due to natural disasters and motor automobile accidents, au- tomobile insurance is a means of transport insurance, including motor automobile damage insurance and motor automobile third-party liability insurance.
Insurance fraud represents a pivotal percentage of insurance company costs. Insurance fraud not only reduces the insurance company profits, resulting in substantive losses, but also affects the in- surance company’s pricing strategy and social economic benefits in the long term.
Model
This paper proposes a novel deep learning model for automobile insurance fraud detection that uses Latent Dirichlet Allocation (LDA)-based text analytics.
In our proposed method, LDA is first used to extract the text features hiding in the text descriptions of the accidents appearing in the claims, and deep neural networks then are trained on the data, which include the text features and traditional numeric features for detecting fraudulent claims. Based on the real-world insurance fraud dataset, our experimental results reveal that the proposed text analytics-based framework outperforms a traditional one.
Evaluation
Data
The data used in this paper are real-world data derived from an automobile insurance company, and the fraud label is confirmed by the insurance company’s professional department. We ultimately obtain 37,082 available items in the dataset, and each item represents an automobile insurance claim. Overall, there are 415 fraudulent claims and 36,667 non-fraudulent claims. In the dataset, the ratio of fraudulent claims to legitimate claims is close to 88:1, which represents imbalanced data. Imbalanced data may greatly affect the performance of classification algorithms. Therefore, sampling methods are employed to solve the data imbalance problem. Because there is a large difference in the amount of data between the classes of claims, we both undersample legitimate claims (majority class) and oversample fraudulent claims (minority class) to balance the dataset [33,34].We use SMOTE to oversample fraudulent claims and randomly undersample legitimate claims to get the same amount of data from the majority class to form a balanced dataset. Finally, the dataset contains 1660 legitimate claims and 1660 fraudulent claims.
Each claim consists of16 attributes and 1 fraudulent label that indicate whether the claimis a fraudulent claim. The attributes can be divid- ed into 10 categorical attributes, 5 numeric attributes and 1 text attribute. A description of the data is provided in Table 1,and summary statistics of the numeric data are listed in Table 2.
Result
Furthermore, the experimental results show that the deep neural networks outperform widely used machine learning models, such as random forests and support vector machine. Therefore, our proposed framework that combines deep neural networks and LDA is a suitable potential tool for automobile insurance fraud detection.
Contribution
This paper makes several contributions to the detection of automobile insurance fraud. First, this paper introduces text mining methods to resolve the text description where the experience of human experts is hidden. The experimental results confirm that the text mining method is important for the analysis of fraudulent behaviors. Second, this paper proposes an LDA- and deep learning-based automobile insurance fraud detection model. The experimental results show that our proposed method is effective. The complement of LDA and the deep learning method makes it possible for themodel to characterize the behavior of automobile insurance fraud. Additionally, the topic extraction process of LDA and the abstraction process of DNN can providemore effective topical features, which cannot be supplied by traditional methods.
Bian Y, Yang C, Zhao J L, et al. Good drivers pay less: A study of usage-based vehicle insurance models[J]. Transportation research part A: policy and practice, 2018, 107: 20-34.
Motivation
Usage-based insurance (UBI) has been attracting more and more attention;
Numerous business opportunities and service modes are created because companies could get access to individual behavior data (Miah et al., 2017).
two open research questions are
how behavioral data of drivers affects driving risk
and how driver behavior should affect UBI pricing schemas.
Research question
The key research question in this research is how to utilize massive behavior data to offer assistance for making personalized UBI pricing strategy
Model
This paper proposes a driver risk classification model to evaluate the risk level of drivers based on in-car sensor data. A Behavior-centric Vehicle Insurance Pricing model (BVIP) and a vehicle premium calculation prototype are developed in this paper. Based on empirical data, our research results show that BVIP achieves better accuracy in terms of risk-level classification and the prototype achieves good performance in terms of effectiveness and usability.
Evaluation
Data
The dataset in our validation process contains two parts: insurants’ driving accident records and matched behavior data.
The behavior data were collected from an online platform (see Fig. 5) maintained by a Chinese data service company. This company has been a provider of On-Board Diagnostics (OBD) devices and has cooperated with some insurance companies for years. The OBD device is a computer-based system device that designed to monitor the performance of a vehicle engine’s major components and to access the GPS information, accelerometer information, etc. During vehicle operation, behavior data (consisting of instantaneous velocity speed, ignition status of the vehicle, engine speed, acceleration, etc.) and geographic location (latitude and longitude) updates every 1 s. The
The insurants’ accident records are acquired from a Chinese insurance company located in Southern China. 206 accident records of insurants whose vehicles had an OBD device for more than 6 months are obtained. This study processes the data as follows: (1) Match the documented accident records with the particular insurant by their OBD device’s serial number; eventually obtain 206 accident records. (2) Remove the records with insurance policy period of less than 3 months. (3) Match the insurants’ accident data with their driving behavior data. (4) Process the missing data and errors in data recording. Finally, 198 individual observations (there are 73 accident-free drivers and 125 accident-involved drivers in the data set) with 215,736 trip records are obtained in total.
Contribution
One important advancement of this study is to utilize supervised machine-learning approach to train the risk-level classification model with relevant sensor features and extend the existing research scope of usage-based insurance by designing a differential behavior-centric pricing mechanism based on in-car sensor data.
Petit J, Shladover S E. Potential cyberattacks on automated vehicles[J]. IEEE Trans. Intelligent Transportation Systems, 2015, 16(2): 546-556.
Motivation
recent development of “self-driving” cars and the announcement by car manufacturers of their deployment by 2020 show that this is becoming a reality. The ITS industry has already been focusing much of its attention on the concepts of “connected vehicles” (United States) or “cooperative ITS” (Europe). These concepts are based on communication of data among vehicles (V2V) and/or between vehicles and the infrastructure (V2I/I2V) to provide the information needed to implement ITS applications. The separate threads of automated vehicles and cooperative ITS have not yet been thoroughly woven together, but this will be a necessary step in the near future because the cooperative exchange of data will provide vital inputs to improve the performance and safety of the automation systems. Thus, it is important to start thinking about the cybersecurity implications of cooperative automated vehicle systems.
Research question
In this paper, we investigate the potential cyberattacks specific to automated vehicles, with their special needs and vul- nerabilities.
In this paper, we address the following questions.
a) How can autonomous automated vehicles be attacked?
b) How can cooperative automated vehicles be attacked?
c) What is the difference between security and privacy mechanisms for autonomous and cooperative automated vehicles?
We analyze the threats on autonomous automated vehicles and cooperative automated vehicles. This analysis shows the need for considerably more redundancy than many have been expecting. We also raise awareness to generate discussion about these threats at this early stage in the development of vehicle automation systems.
Assumptions
The focus of attention for this paper is on systems that provide a high enough level of automation of the dynamic driving task that the driver is no longer required to monitor the driving environment for external threats.
Attacker Model
Internal Versus External: The internal attacker is an authenticated member of the network that can communicate with other members. The external attacker is considered by the network members as an intruder and, hence, is limited in the diversity of attacks. Nevertheless, she/he can eavesdrop on the communication.
Malicious Versus Rational: A malicious attacker seeks no personal benefits from the attacks, and aims to harm the mem- bers or the functionality of the network. Hence, she/he may employ any means disregarding corresponding costs and con- sequences. On the contrary, a rational attacker seeks personal profit and, hence, is more predictable in terms of attack means and attack target.
Active Versus Passive: An active attacker can generate packets or signals to perform the attack, whereas a passive attacker only eavesdrops on the communication channel (i.e., wireless or in-vehicle wired network).
Local Versus Extended: An attacker can be limited in scope, even if she/he controls several entities (vehicles or base sta- tions), which make him/her local. An extended attacker controls several entities that are scattered across the network, thus extending his/her scope.
Intentional Versus Unintentional: An intentional attacker generates attacks on purpose, whereas an unintentional attack is a cyber incident that could be generated by faulty sensors or equipments.
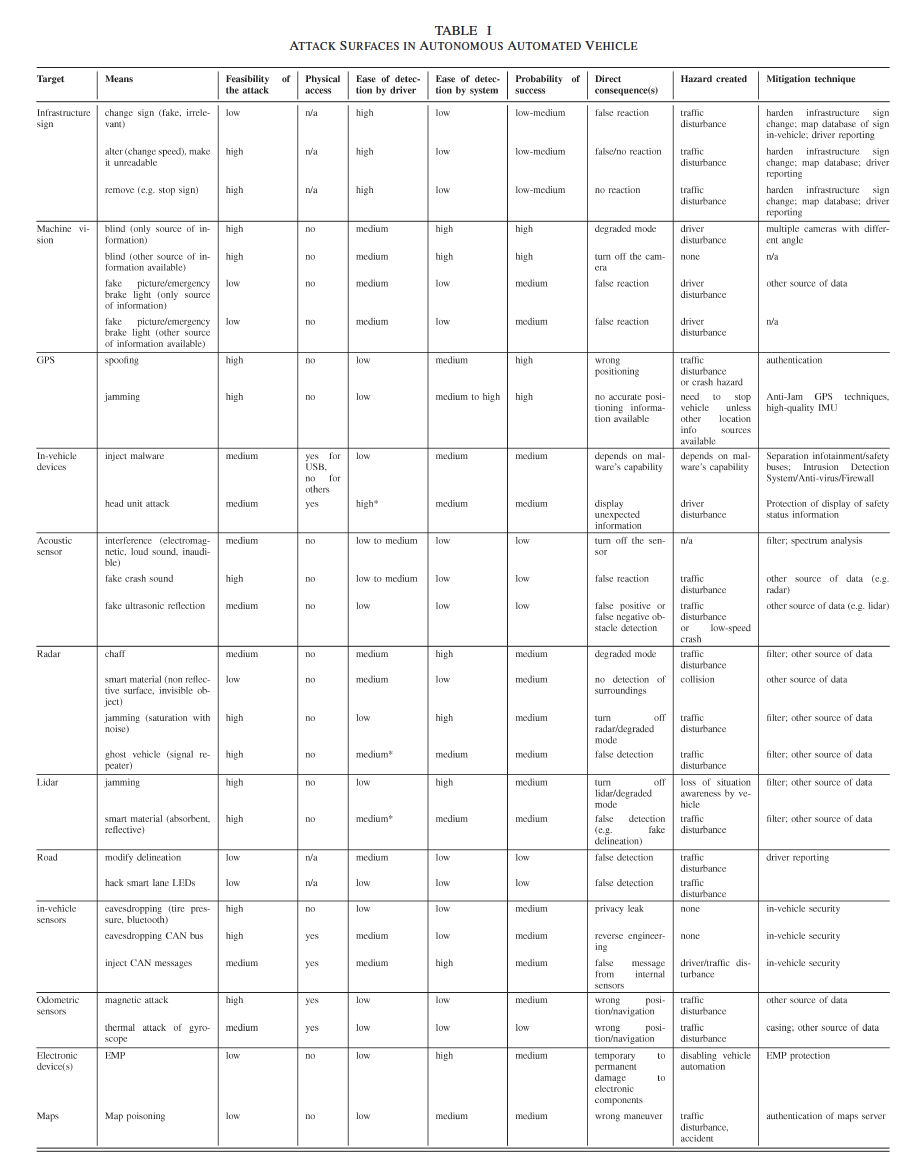
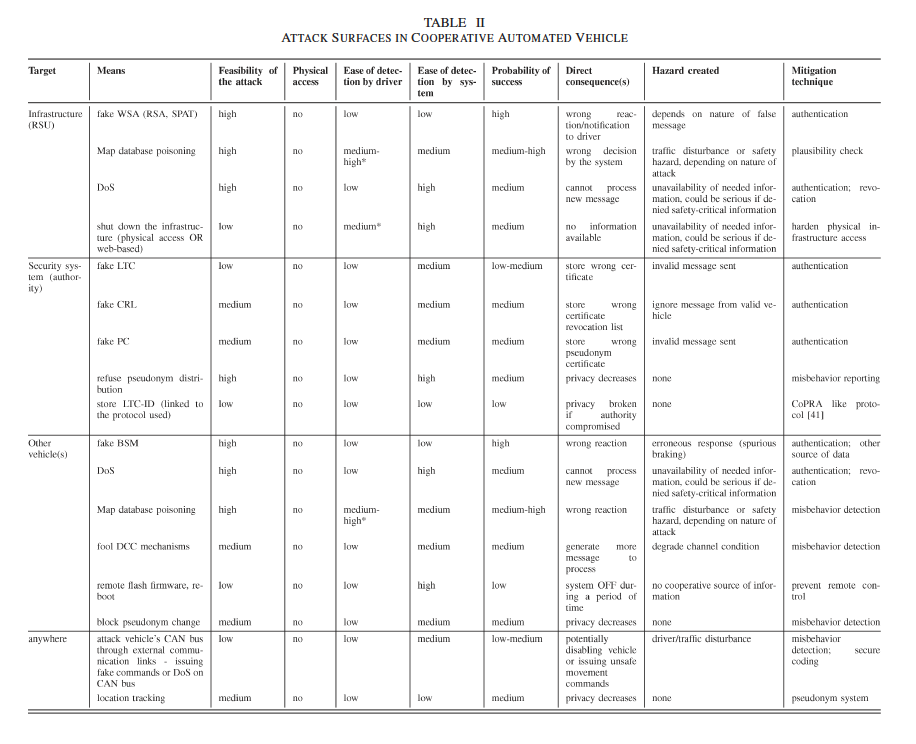
Methodology
we first list the attack surfaces (i.e., the entry point of the attack) for autonomous automated vehicles, and cooperative automated vehicles. For each attack we define the following criteria:
a) Means: Describes the attack performed on the attack surface.
b) Feasibility of the attack (FA): Describes the level of knowledge needed to perform the attack.
c) Need for physical access to the targeted vehicle (PA):Is physical access to the targeted vehicle required to run the attack? (yes/no)
d) Ease of detection by driver: Can the driver detect the attack?
e) Ease of detection by the system (EDS): Can the system detect the attack?
f) Probability of attack success (PAS): Based on the previ- ous criteria, we assess the probability of success of the attack.
g) Consequence for the vehicle: Describes the direct conse- quence(s) for the vehicle such as entering in minimal risk condition.
h) Hazard created: At a macroscopic point of view, de- scribes the hazard created by the attack (e.g., traffic disturbance)
i) Mitigation technique(s): Describes the mitigation tech- nique(s) that can be deployed to mitigate the impact of such attack.
SECURITY AND PRIVACY THREATS:CASE OF AUTONOMOUS AUTOMATED VEHICLES
SECURITY AND PRIVACY THREATS:CASE OF COOPERATIVE AUTOMATED VEHICLES
Janai J, Güney F, Behl A, et al. Computer vision for autonomous vehicles: Problems, datasets and state-of-the-art[J]. arXiv preprint arXiv:1704.05519, 2017.
Motivation
While several topic specific survey papers have been written, to date no general survey on problems, datasets and methods in computer vision for autonomous vehicles exists. This paper attempts to narrow this gap by providing a state-of-the-art survey on this topic.
Research goal
Our survey includes both the historically most relevant literature as well as the current state-of-the-art on several specific topics, including recognition, reconstruction, motion estimation, tracking, scene understanding and end-to-end learning.
About future
it is safe to believe that fully autonomous navigation in arbitrarily complex environments is still decades away. The reason for this is two-fold: First, autonomous systems which operate in complex dynamic environments require artificial intelligence which generalizes to unpredictable situations and reasons in a timely manner. Second, informed decisions require accurate perception, yet most of the existing computer vision systems produce errors at a rate which is not acceptable for autonomous navigation. 泛化能力 & 准确率
2. Datasets & Benchmarks
2.1 Real-World Datasets
- Stereo and 3D Reconstruction
- Optical Flow
- Object Recognition and Segmentation
- Tracking
- Aerial Image Datasets
- Autonomous Driving
- Long-Term Autonomy
2.2 Synthetic Data
- MPI Sintel
- Flying Chairs and Flying Things
- Game Engines
3. Cameras Models & Calibration
3.1. Calibration Multiple
3.2. Omnidirectional Cameras
3.3. Event Cameras
4. Representations
- Superpixels
- Stixels
- 3D Primitives
5. Object Detection
- Sensors
- Standard Pipeline
- Classificatio
- Part-based Approaches
5.1. 2D Object Detection
5.2. 3D Object Detection from 2D Images
5.3. 3D Object Detection from 3D Point Clouds
5.4. Person Detection
5.5. Human Pose Estimation
6. Semantic Segmentation
- Formulation
- Structured CNNs
- Conditional Random Fields
6.1. Semantic Instance Segmentation
6.2. Label Propagation
6.3. Semantic Segmentation with Multiple Frames
6.4. Semantic Segmentation of 3D Data Autonomous
6.5. Semantic Segmentation of Street Side Views
6.6. Semantic Segmentation of Aerial Images
6.7. Road Segmentation Segmentation
7. Reconstruction
7.1. Stereo
7.2. Multi-view 3D Reconstruction
7.3. Reconstruction and Recognition
8. Motion & Pose Estimation
8.1. 2D Motion Estimation – Optical Flow
8.2. 3D Motion Estimation – Scene Flow
8.3. Ego-Motion Estimation
8.4. Simultaneous Localization and Mapping (SLAM)
8.5. Localization
9. Tracking
9.1. Tracking with Stereo
9.2. Pedestrian Tracking
9.3. State-of-the-art
10. Scene Understanding
11. End-to-End Learning of Sensorimotor Control
Harper C D, Hendrickson C T, Mangones S, et al. Estimating potential increases in travel with autonomous vehicles for the non-driving, elderly and people with travel-restrictive medical conditions[J]. Transportation research part C: emerging technologies, 2016, 72: 1-9.
Motivation
Automated vehicles represent a technology that promises to increase mobility for many groups, including the senior population (those over age 65) but also for non-drivers and people with medical conditions.
Research goal
The objective of this paper is to estimate bounds on the impact of a fully automated vehicle environment based on VMT by the current U.S population 19 and older due to new demand from currently underserved populations.
this paper is only concerned with changes in the travel patterns of the elderly, non-driving populations, and those with a travel restrictive medical condition relative to current conditions.
Data
The primary source of data for this project is the 2009 National Household Transportation Survey (NHTS), which provides information on current travel characteristics of the U.S. population (USDOT, 2011).
National Household Transportation Survey (NHTS)
The U.S. Department of Transportation (USDOT) periodically releases information on the travel and transportation char- acteristics of the United States by conducting a representative nationwide survey, in order to assist policymakers and trans- portation planners in quantifying travel behavior and analyzing changes in travel characteristics over time. The 2009 National Household Travel Survey is the most recent national survey and contains significantly more data than any previous survey in the NHTS series, which allows for an expanded assessment of the travel behaviors in the United States. Specifically, the 2009 NHTS dataset contains a large sample size of 150,147 households for the U.S. Along with any household informa- tion, the 2009 NHTS dataset also includes person, vehicle and daily (travel day) trip level data.
Method
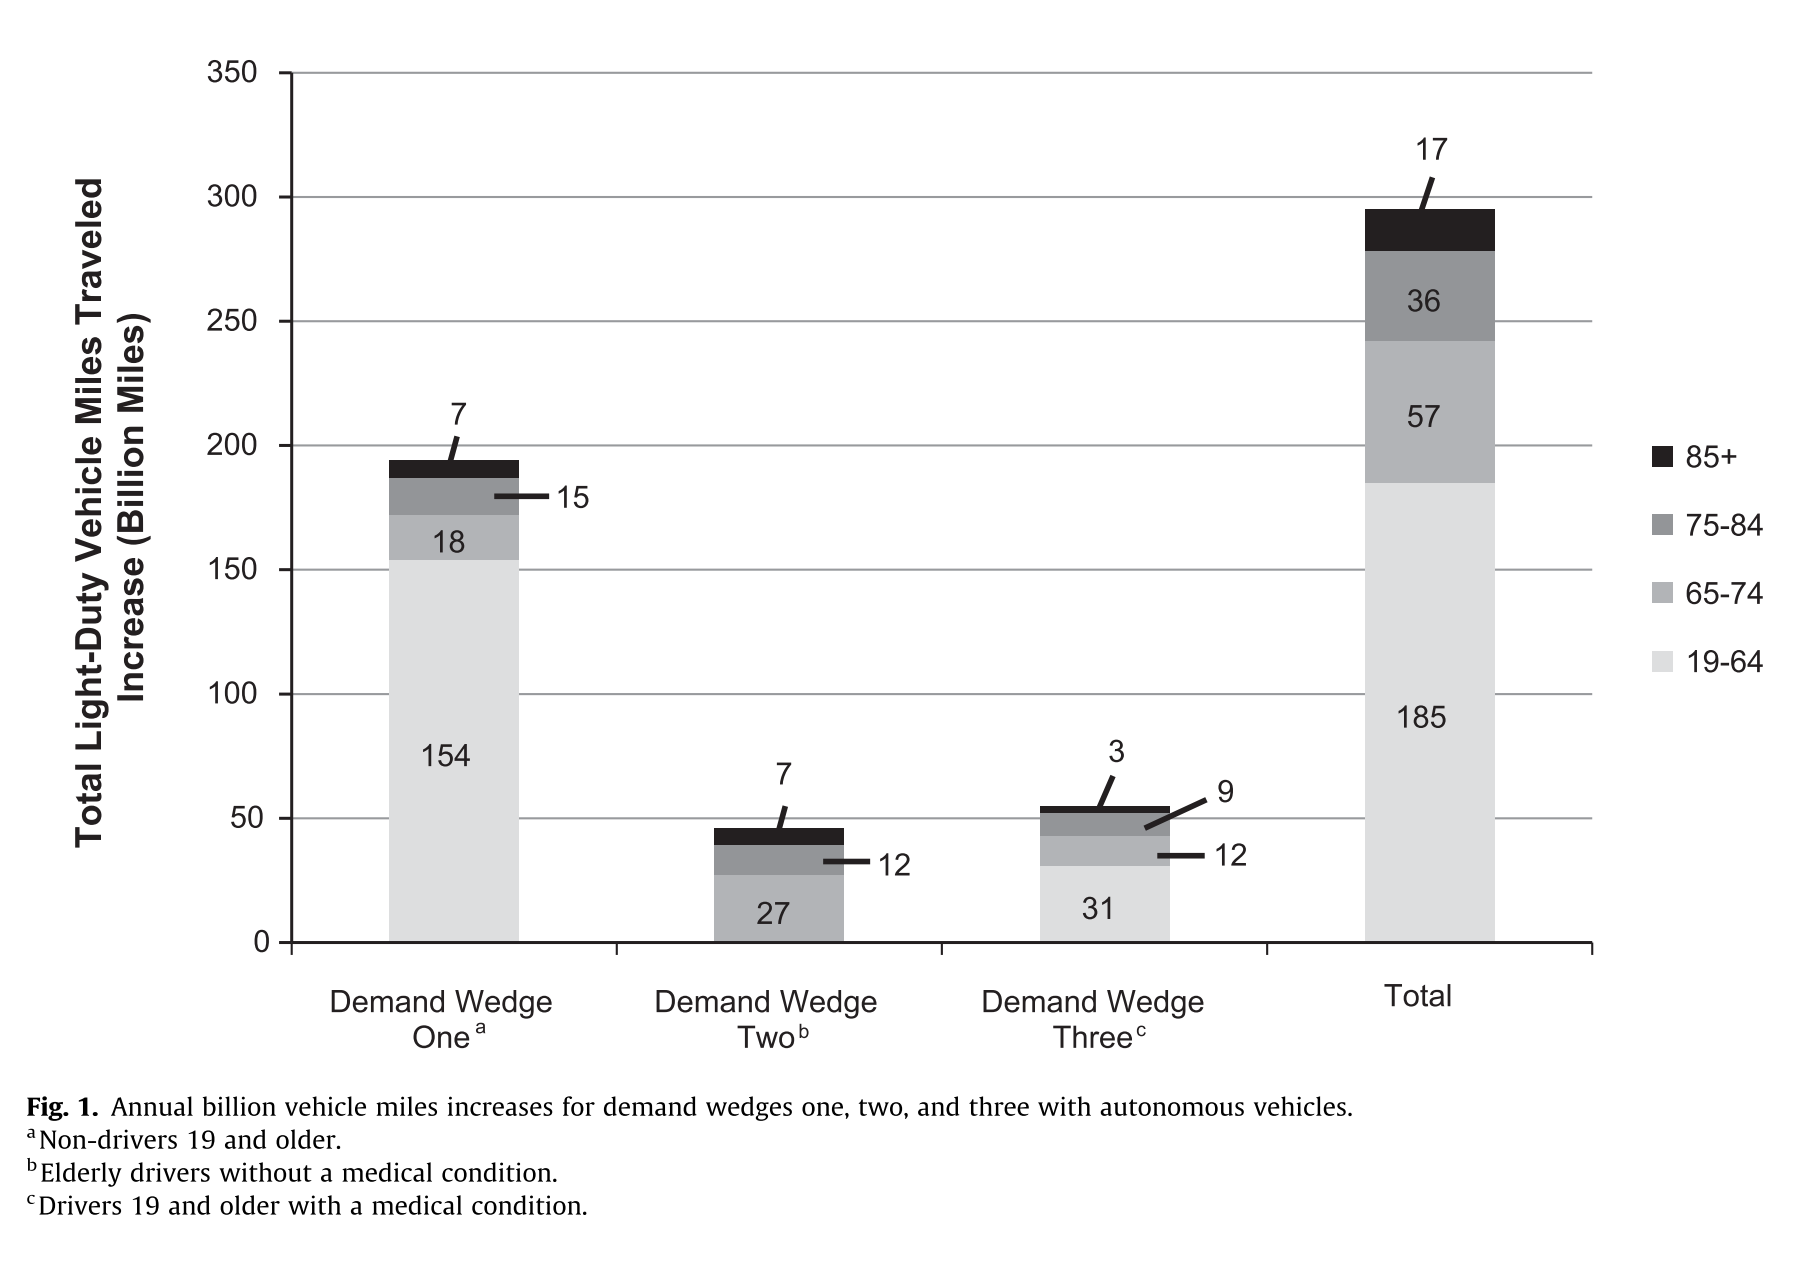
This paper estimates bounds on the potential increases in travel in a fully automated vehicle environment due to an increase in mobility from the non-driving and senior populations and people with travel-restrictive medical conditions.
Demand wedge 1: Non-drivers 19 and older will begin to travel as much as the drivers within each age group and gender.
Demand wedge 2: Elderly drivers without any travel-restrictive medical condition in the youngest elderly cohort (65–74) will begin to travel as much as working age adults (19–64) within each gender. While, elderly drivers without any med- ical condition in the middle (75–84) and oldest elderly (85+) cohort will travel as much as a person 65 years of age within each gender.
Demand wedge 3: Working age adult drivers (19–64) with a medical condition that makes it hard to travel will begin to travel as much as working age adults without medical conditions in each gender. Elderly drivers with travel restrictive medical conditions in the youngest elderly cohort (65–74) will begin to travel as much as working age adults (19–64) within each gender. Elderly drivers with a medical condition in the middle (75–84) and oldest elderly (85+) cohort will travel as much as a person 65 years of age within each gender.
Results
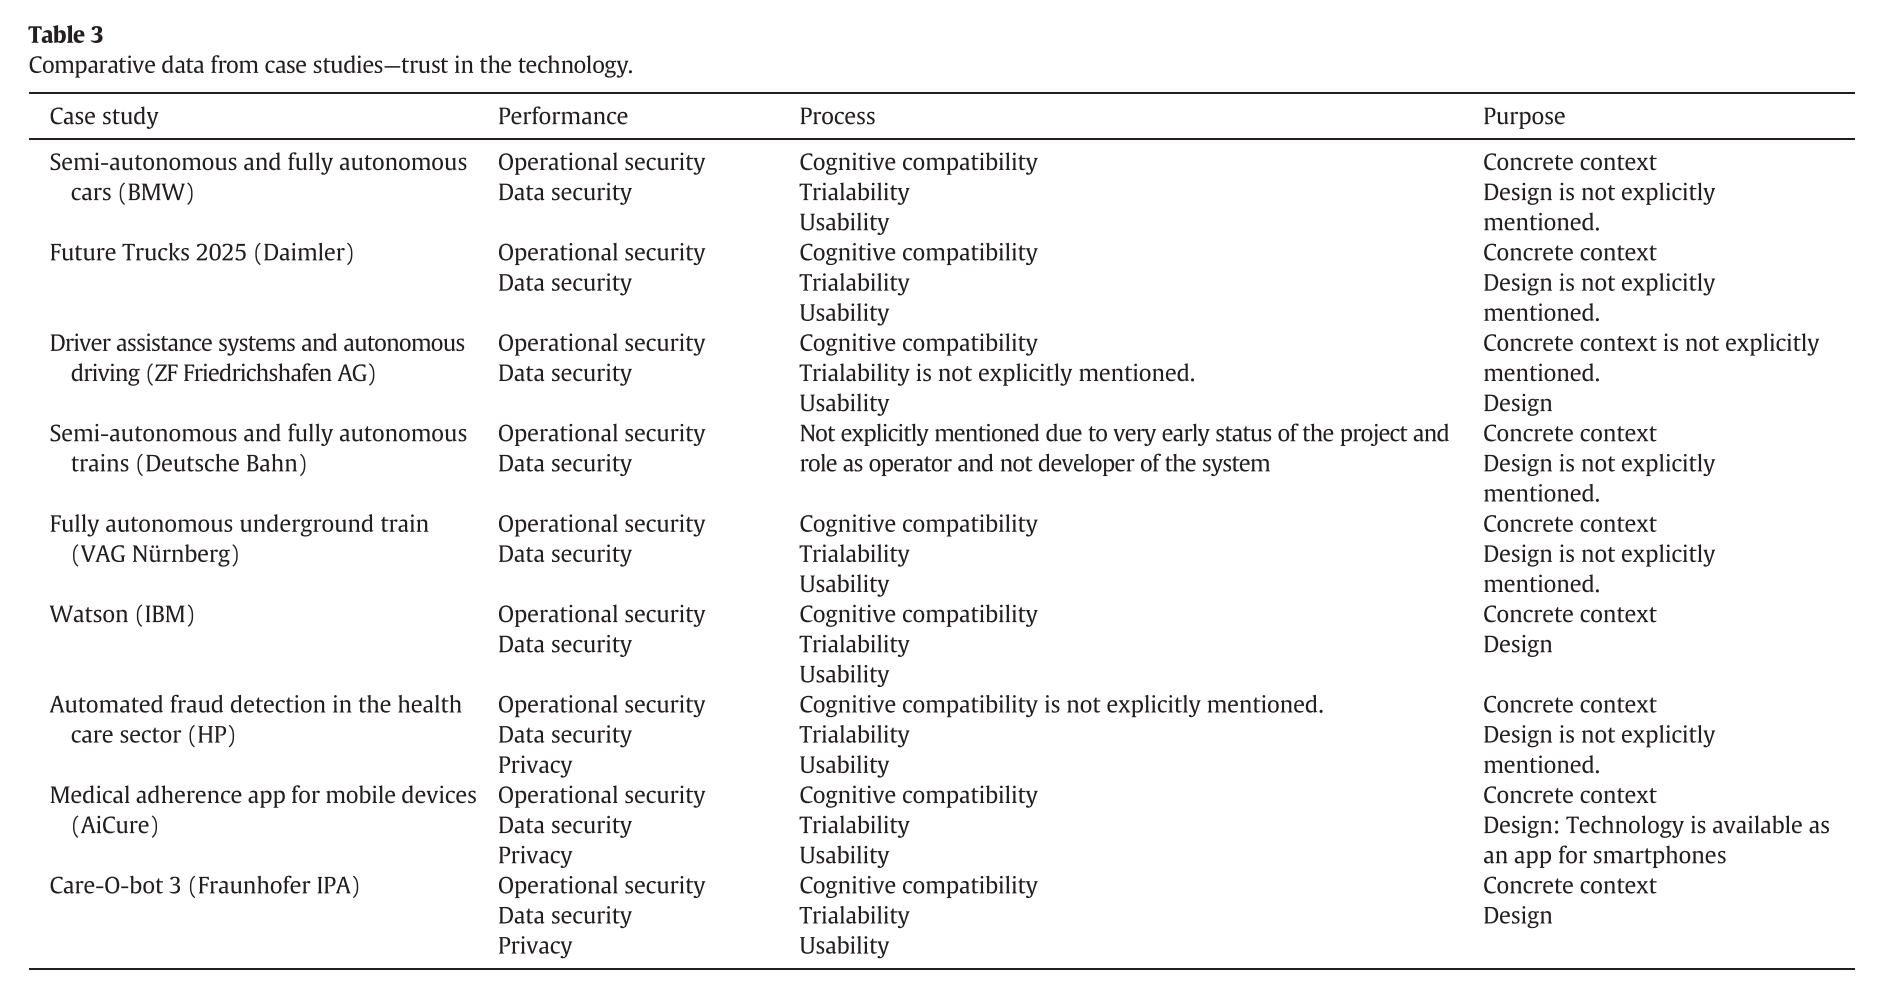
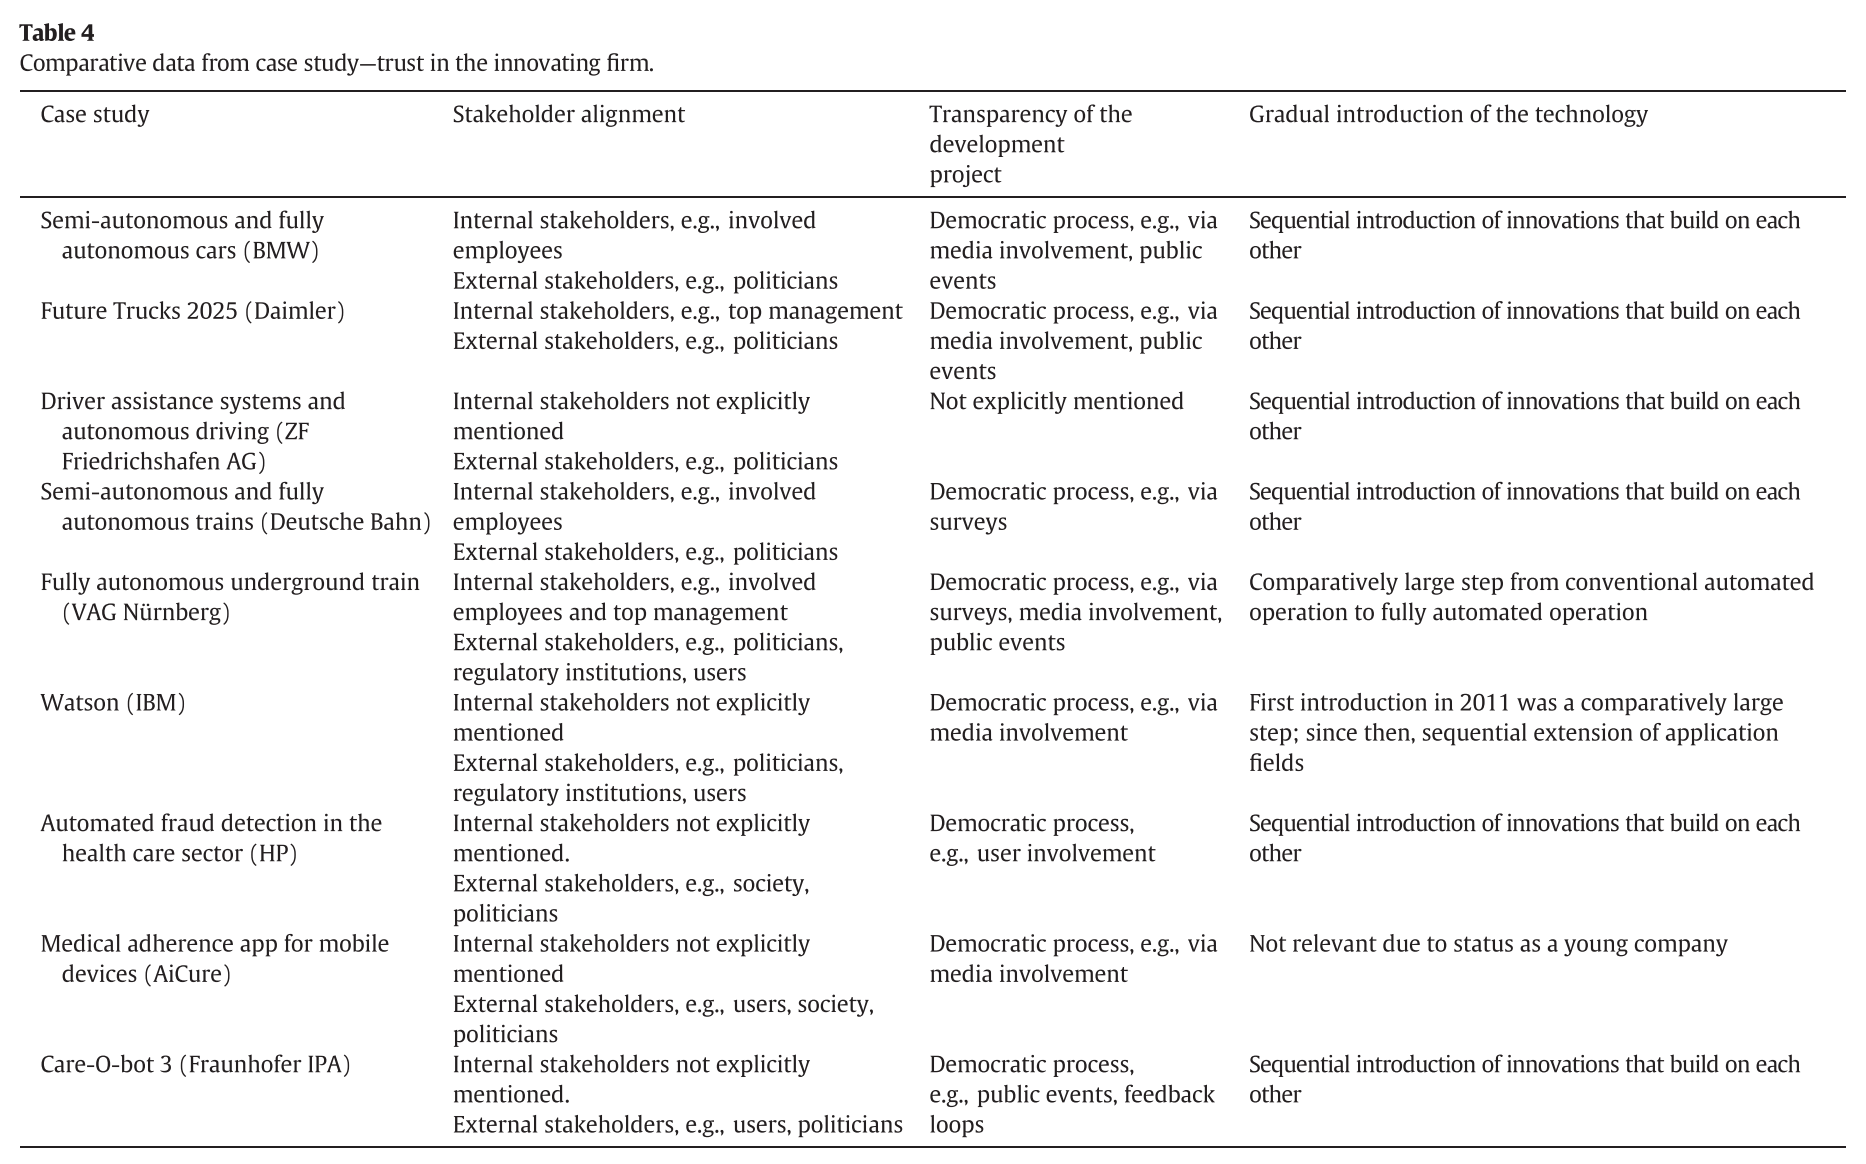
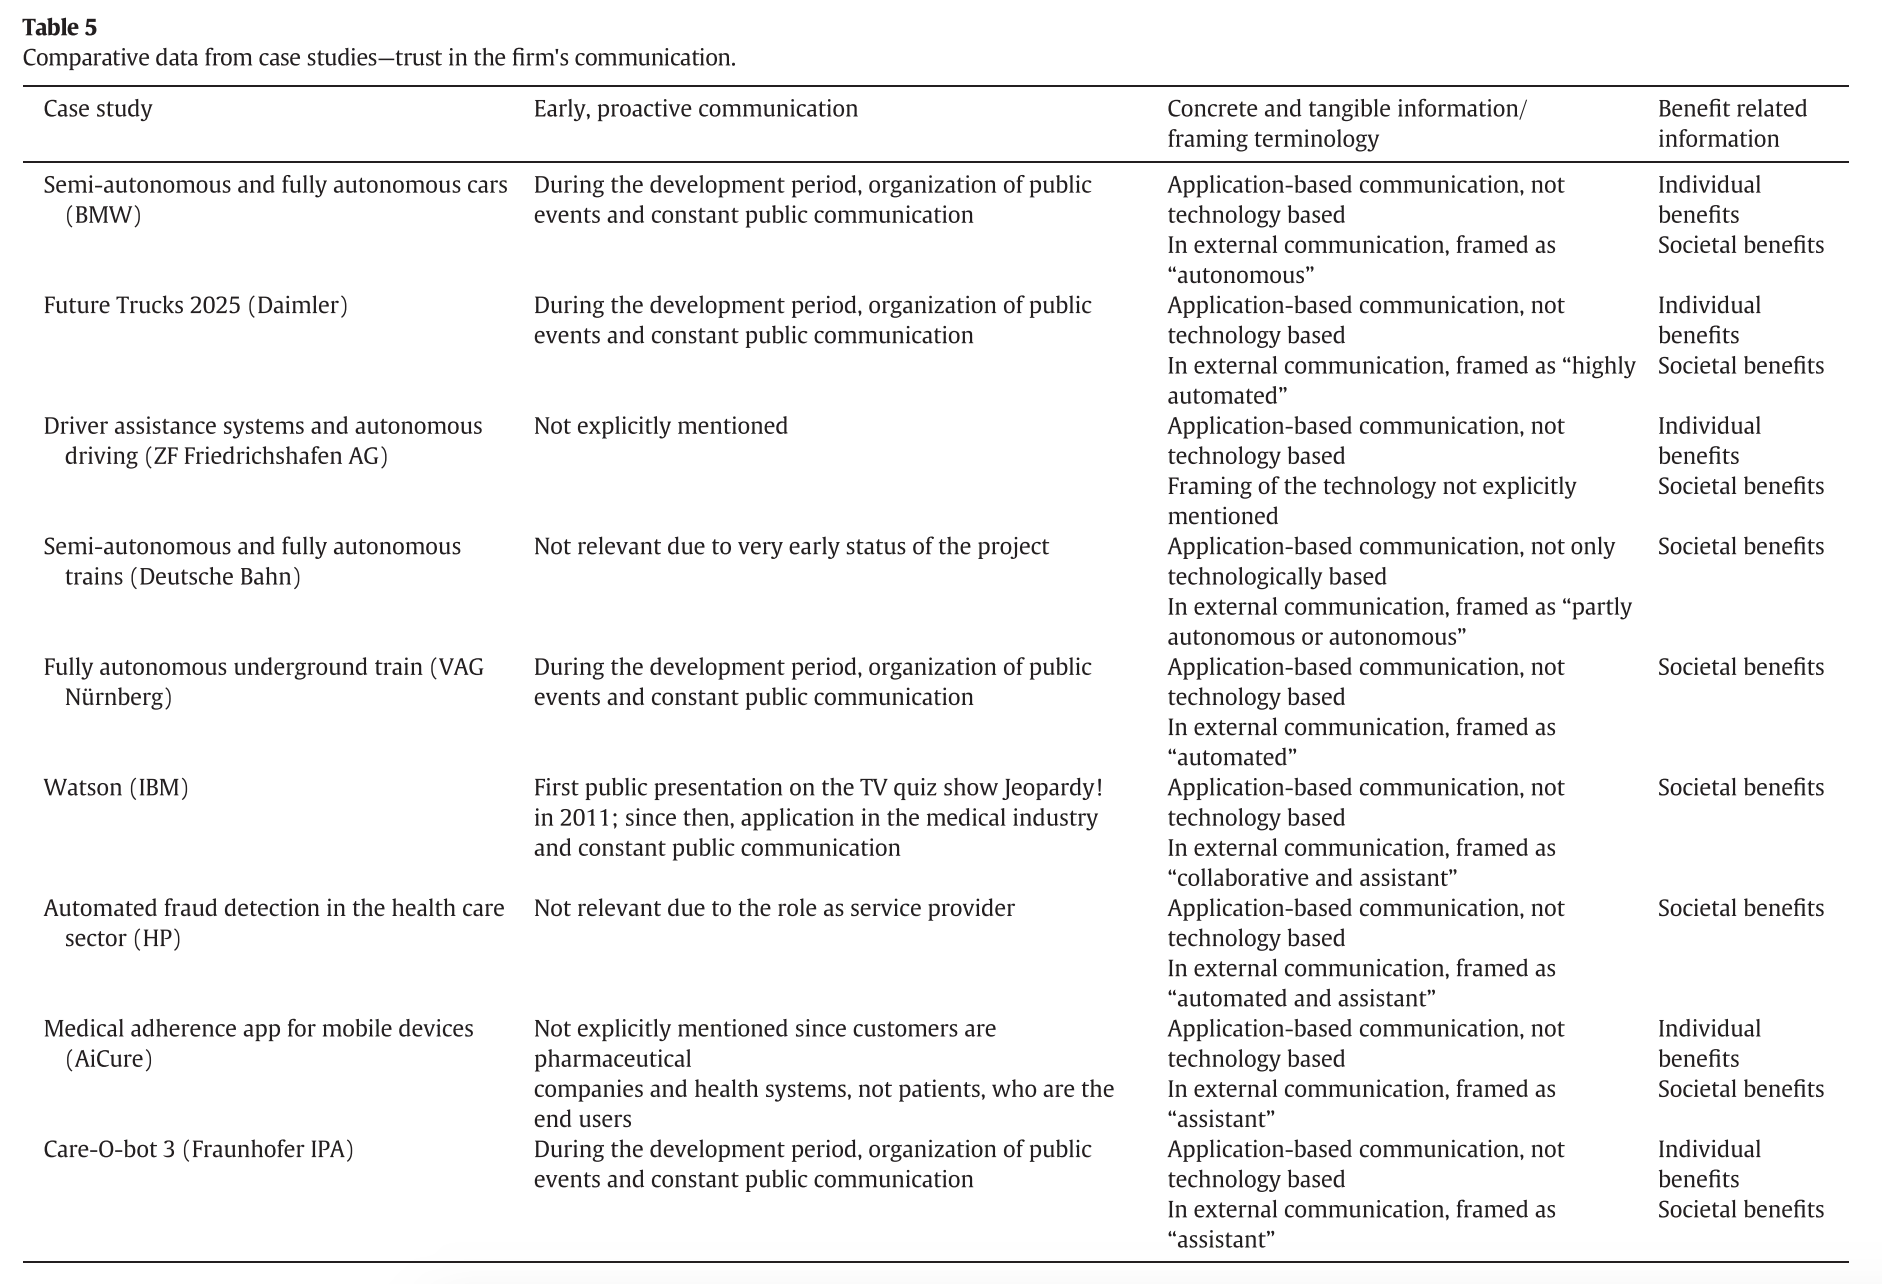
Hengstler M, Enkel E, Duelli S. Applied artificial intelligence and trust—The case of autonomous vehicles and medical assistance devices[J]. Technological Forecasting and Social Change, 2016, 105: 105-120.
Motivation
Automation with inherent artificial intelligence (AI) is increasingly emerging in diverse applications, for instance, autonomous vehicles andmedical assistance devices. However, despite their growing use, there is still noticeable skepticism in society regarding these applications.
Research goal
this paper explores how firms systematically foster trust regarding applied AI.
Data
Nine firms declared their intention to contribute to our research.
The five cases from the transportation industry include car, truck, train, and underground train technologies:
- BMW
- Daimler
- ZF Friedrichshafen AG
- Deutsche Bahn
- VAGNürnberg
The four cases from the medical technology industry include
- IBM
- HP
- AiCure
- Fraunhofer IPA
Results
Trust in technology
- Performance
- Process
- Purpose
Trust in innovating firm
- stakeholder alignment
- Transparency of the development project
- Gradual introduction of the technology
Conmunication
- Early, proactive communication
- Concrete and tangible information/ framing terminology
- Benefit related information
Contribution
Our studymakes five contributions to theory.
First, we examine trust in applied AI via a discipline spanning approach and accordingly contribute to the cognitive engineering, innovation management, and sociology literature.
Second, we consider technology acceptance based on the single construct of trust. Consequently, we diverge from earlier technology acceptance literature based on the technology acceptance model (TAM) (Davis, 1989).
Third, our results illustrate the dichoto- mous constitution of trust in applied AI, which is formed by a symbiosis of trust in the technology as well as trust in the innovating firm and its communication.
Fourth, our results provide tangible approaches that can be applied alongside the three bases of trust in automation identi- fied by Lee and Moray (Lee and Moray, 1992). Accordingly, trust in the technology evolves alongside performance, process, and purpose information. The performance basis is primarily reliant on both opera- tional and data security aspects; the process basis is determined by cognitive compatibility and usability ofthe application; and the purpose basis is founded on application context and design.
Fifth, we illustrate the necessity of a democratic development process for applied AI (e.g., via stakeholder alignment, transparency in development, and early, proactive communication).
Greenlee E T, DeLucia P R, Newton D C. Driver vigilance in automated vehicles: hazard detection failures are a matter of time[J]. Human factors, 2018, 60(4): 465-476.
Motivation
Although automated vehicles are relatively novel, the nature of human-automation interaction within them has the classic hallmarks of a vigilance task. Drivers must maintain attention for prolonged periods of time to detect and respond to rare and unpredictable events, for example, roadway hazards that automation may be ill equipped to detect. Given the similarity with traditional vigilance tasks, we predicted that drivers of a simulated automated vehicle would demonstrate a vigilance decrement in hazard detection performance.
Research goal
The primary aim of the current study was to determine whether monitoring the roadway for hazards during automated driving results in a vigilance decrement.
Method
Participants “drove” a simulated automated vehicle for 40 minutes. During that time, their task was to monitor the roadway for roadway hazards.
Twenty-two individuals (7 men, 15 women) ranging in age from 18 to 22 years (Mage = 19.36, SD = 1.33) completed the current study in exchange for course credit. All
Result
As predicted, hazard detection rate declined precipitously, and reaction times slowed as the drive progressed. Further, subjective ratings of workload and task-related stress indicated that sus- tained monitoring is demanding and distressing and it is a challenge to maintain task engagement.
Monitoring the roadway for potential hazards during automated driving results in workload, stress, and performance decrements similar to those observed in traditional vigilance tasks.
some useful opinion
When automation is used to relieve a human operator of task duties, the operator is not relieved of work. Instead, the nature of the work changes. Human-automation interaction typically requires that an operator remain alert and attentive so that they can monitor one or more automated systems and be prepared to intervene should automation fail (Sheridan, 2002).
Indeed, various automated vehicle technolo- gies are rapidly being developed and deployed as developers aim to improve roadway safety by transferring driving duties from human to machine (Smith et al., 2015).
Events that require a driver to retake manual control of a partially automated vehicle can be split into two distinct conceptual categories based on whether the automated driving system initiates the transition to manual control, and that distinction has implications for the need for sustained monitoring.
Other researchers have raised similar concerns and noted the probable importance of vigi- lance in partially automated vehicles (e.g., Kör- ber, Cingel, Zimmermann, & Bengler, 2015; Körber, Schneider, & Zimmermann, 2015; Mok et al., 2015).
many studies of distraction in partially automated vehicles reflect the negative consequences of automation misuse rather than proper use (Parasuraman & Riley, 1997). Though misuse is a possibility, the current study focuses on the consequences of proper automation use. Given
Zhang W, Guhathakurta S, Fang J, et al. Exploring the impact of shared autonomous vehicles on urban parking demand: An agent-based simulation approach[J]. Sustainable Cities and Society, 2015, 19: 34-45.
Motivation
little is known about how SAVs can change urban forms, especially by reducing the demand for parking. This study estimates the potential impact of SAV system on urban parking demand under different system operation scenarios with the help of an agent-based simulation model.
Model
This simulation is conducted on a 10×10mi grid based hypothetical city. The resolution of the grids, which also represents the street network, is 0.5 mi. The client agents in this model are peo- ple who are willing to use the SAV system. It is assumed that the SAV system has a low penetration rate of 2% within the region. In other words, only 2% of population within the simulated city will use the SAV system instead of private vehicles.
Model parameters
The client agents in this model are peo- ple who are willing to use the SAV system.
It is assumed that the SAV system has a low penetration rate of 2% within the region. In other words, only 2% of population within the simulated city will use the SAV system instead of private vehicles.
SAVs are assigned by the vehicle–client match center to serve clients.
Model specifications and implementation
-
Client agents and vehicle trip generation
Trip departure time and length assignment
Trip destination assignment
- SAV fleet size and operation rules
- SAV–client match center
Result
The simulation results indicate that we may be able to eliminate up to 90% of parking demand for clients who adopt the system, at a low market penetration rate of2%. The results also suggest that different SAV operation strategies and client’s preferences may lead to different spatial distribution of urban parking demand.
5.1 Impact ofSAV fleet size on urban parking demand
the total daily parking demand is positively correlated with SAV fleet size. The results show that adding another 50 vehicles into the system is likely to increase the urban parking demand by approximately 150 and the increase is quite constant.
after adding more vehicles in the system, the average daily parking demand per serving SAV will decrease.
the average wait times for SAVs improve significantly withmore vehicles in the system but the gains become smaller as the numbers get larger.
The simulation results also indicate that the parking demand is higher in the center of the simulated area.
5.2. Impact ofride-sharing and client’s preference on urban parking demand
the total daily parking demand is not sensitive to the level of willingness to share.
Such outcome is heavily influenced by the fact that we always assign the SAVs with the least potential time cost to each customer. In other words, the client-SAV match center may always prioritize an empty SAV for each client to avoid additional detour time costs. Therefore, even if people are willing to share, limited number of trips are linked together given the least travel time cost assignment method.
the most significant reduction of parking demand occurs in the urban fringe area once people start to share rides with others.
5.3. Impact ofvehicle cruising on urban parking demand
the SAVs will continue relocating themselves to places where the anticipated number of clients is high while the existing number of SAVs is low.
longer the empty cruising time allowed in the system, lower the parking demand.
The parking demand tends to be more evenly distributed throughout the study area, the longer the vehicle cruise.
Hevelke A, Nida-Rümelin J. Responsibility for crashes of autonomous vehicles: an ethical analysis[J]. Science and engineering ethics, 2015, 21(3): 619-630.
Motivation
A number of companies including Google and BMW are currently working on the development of autonomous cars. But if fully autonomous cars are going to drive on our roads, it must be decided who is to be held responsible in case of accidents. This involves not only legal questions, but also moral ones. The
Research question
The first question discussed is whether we should try to design the tort liability for car manufacturers in a way that will help along the development and improvement of autonomous vehicles. In particular, Patrick Lin’s concern that any security gain derived from the introduction of autonomous cars would constitute a trade-off in human lives will be addressed.
The second question is whether it would be morally permissible to impose liability on the user based on a duty to pay attention to the road and traffic and to intervene when necessary to avoid accidents.
The last option discussed in this paper is a system in which a person using an autono- mous vehicle has no duty (and possibly no way) of interfering, but is still held (financially, not criminally) responsible for possible accidents. Two ways of doing so are discussed, but only one is judged morally feasible.
Responsibility of the Manufacturer
The clearest answer is a practical one: if in the case of crashes involving autonomous vehicles the main responsibility were to be that of the manufacturers, ‘‘the liability burden on the manufacturer may be prohibitive of further development.’’ (Marchant and Lindor 2012).
Of course, full legislative protection from liability would probably also have undesirable effects: ‘‘it diminishes, if not eliminates, the incentives for manufacturers to make marginal improvements in the safety of their products in order to prevent liability.’’ (Marchant and Lindor 2012) Could a partial liability be designed in such a way that the continuous development and improvement of autonomous vehicles would not be impeded but promoted? It seems likely, but this question would have to be discussed and answered elsewhere. An ethical analysis would not solve it.
There is, on the other hand, the question of whether we should try to promote the development of autonomous cars to begin with. In other words: should we try to design the liability for autonomous vehicles in such a way that it promotes their continuous development and improvement? Should such vehicles be allowed on our streets? These questions can be addressed through normative ethics. If there are good moral reasons for finding the development and introduction of autonomous cars to be desirable, this can produce a moral obligation for the state to fashion the legal responsibility for crashes of autonomous cars in a way which helps the development and improvement of autonomous cars.
When we say autonomous cars can slash fatality rates by half, we really mean that they can save a net total of 16,000 lives a year: for example, saving 20,000 people but still being implicated in 4,000 new deaths. There’s something troubling about that, as is usually the case when there’s a sacrifice or ‘‘trading’’ of lives. The identities of many (future) fatality victims would change with the introduction of autonomous cars.
some current non-victims—people who already exist—would become future victims, and this is clearly bad.’’ (Lin 2013).
A violation of some person’s fundamental rights cannot be legitimized on the basis of benefits for others, no matter how large.
The introduction of autonomous vehicles is quite different from the paradigm of trolley-cases.5 In contrast to the standard trolley-case, we should not focus on the actual damage done in the end, when we try to determine if a decision in favour of autonomous vehicles is in the interest of one of the affected parties. Instead, the risks at the time of the decision should become central. Whether or not the introduction of a new safety feature is in the interest of a person does not depend on whether or not the person in question does have an accident in the end or how bad it may come to be. It depends on whether the feature improves his chances of avoiding the accident or reduce possible damage.
If that proves to be the case, it would certainly pose a problem. Otherwise, Lin’s concerns are unfounded.6 The introduction of autonomous cars would be no different (in this regard) to the introduction of already well-established safety features such as seatbelts or glued-in laminated windshields.
A Duty to Intervene
The liability of the driver in the case of an accident would be based on his failure to pay attention and intervene. Autonomous vehicles would thereby lose much of their utility. It would not be possible to send the vehicle off to look for a parking place by itself or call for it when needed. One would not be able to send children to school with it, use it to get safely back home when drunk or take a nap while traveling. However, these matters are not of immediate ethical relevance.
As long as there is some evidence that a system in which people must intervene would do noticeably better in terms of number of accidents than one in which autonomous vehicles are left to themselves there is much to be said in favour of such a duty.
But even assuming such intervention was possible, if the person in question were sufficiently focussed, one might still question if people would be able to keep up the necessary attention over longer periods of time.
However, if it becomes clear that humans are typically not able to effectively intervene when necessary to avert imminent accidents involving sophisticated autonomous vehicles, it becomes problematic to blame a person for an accident just because he did not – indeed could not prevent it.
Responsibility of the Driver as a Form of a ‘‘Strict Liability’’
One alternative would be an approach in which the person in charge of the autonomous vehicle has no duty (and possibly no way) of interfering, but still be considered morally responsible for possible accidents.
This would speak in favour of a system in which the cost of any accident caused by a (well-maintained, up to date, non-tampered-with etc.) autonomous vehicle is shared by all the owners/users of such vehicles.
This position is based on the assumption that it is possible to draw a clear line between the blameless driver and the (at least partly) guilty one.
For this very same reason we might blame a person using a sophisticated autonomous vehicle if it causes an accident-at least partly. He did decide to use a car, fully aware that he might hit another person, a child.
This means no driver could ever be ‘‘absolutely without fault’’ if his vehicle runs into another human being. It was a risk he knew about, a risk he took. Some sort of liability can always be morally justified when using dangerous vehicles like cars that have a chance of injuring others. Usually this might not be a major problem, but it is one for the Nagelian notions of moral luck, since according to him, bad luck is only morally irrelevant if the driver is ‘‘absolutely without fault’’—which he never is.
Conclusion
We discussed who should be held responsible for accidents of fully autonomous cars from a moral stand point. Both the duty to intervene and a responsibility of the driver as a form of a ‘‘strict liability’’ seem like viable options.
In the case of a duty to intervene this depends on there being an actual chance for the driver to effectively anticipate and prevent accidents. If the average driver never had a real chance of preventing an accident (either in the particular case at hand or in principle) he should not be held responsible for it. Therefore this option seems more attractive to us as an interim solution for the period in which autonomous cars are first introduced and developed. Once the development of autonomous cars has reached a point where people cannot effectively intervene any more, a contra factual duty to do so would be morally indefensible. Also, a duty to intervene would keep autonomous cars from being useable by the blind, elderly, etc.
In the case of a responsibility of the driver as a form of a ‘‘strict liability’’, scenario (A) is the more viable one. It is justifiable to hold users of autonomous cars collectively responsible for any damage caused by such vehicles–even if they had no way of influencing the cars behaviour. However, this responsibility should not exceed a responsibility for the general risk taken by using the vehicle. A tax or a mandatory insurance seems the easiest and most practical means to achieve that.
Assuming the implementation of autonomous cars would save lives, this by itself constitutes a powerful moral reason to limit the possible responsibilities of manufacturers to a point where it does not render the development of such cars too risky for the companies involved. Of course, manufacturers should not be freed of their liability in cases like the Ford Pinto, in which the manufacturers put the car on the market fully knowing that it had major safety defects, but considered rectifying those flaws too expensive. Also, a certain amount of responsibility for accidents not is only morally desirable in itself but also an important incentive for the continuous development and improvement of such cars.
Bayat B, Crasta N, Crespi A, et al. Environmental monitoring using autonomous vehicles: a survey of recent searching techniques[J]. Current opinion in biotechnology, 2017, 45: 76-84.
Motivation
Autonomous vehicles are becoming an essential tool in a wide range of environmental applications that include ambient data acquisition, remote sensing, and mapping of the spatial extent of pollutant spills. Among these applications, pollution source localization has drawn increasing interest due to its scientific and commercial interest and the emergence of a new breed of robotic vehicles capable of operating in harsh environments without human supervision.
Research goal
The aim is to find the location of a region that is the source of a given substance of interest (e.g. a chemical pollutant at sea or a gas leakage in air) using a group of cooperative autonomous vehicles.
Motivated by fast paced advances in this challenging area, this paper surveys recent advances in searching techniques that are at the core of environmental monitoring strategies using autonomous vehicles. Addresses
Krueger R, Rashidi T H, Rose J M. Preferences for shared autonomous vehicles[J]. Transportation research part C: emerging technologies, 2016, 69: 343-355.
Writing is good.
Motivation
For the design of effective policies aiming to realize the advan- tages of SAVs, a better understanding ofhow SAVs may be adopted is necessary.
Research goal
This article intends to advance future research about the travel behavior impacts ofSAVs, by identifying the characteristics ofuserswhoare likely to adoptSAVservices andby eliciting willingness to pay measures for service attributes.
to the best of the authors’ knowledge, only two studies have specifically dealt with the adoption of SAVs. Haboucha et al. (2015) draw from stated preference data to investigate car owners’ propensity to switch to SAVs on work-related and education-related trips. Furthermore, Bansal et al. (2016) analyze individuals’ stated frequencies to use SAVs under different pricing scenarios and identify the characteristics of potential SAV adopters. This current study distinguishes itself from previous studies by explicitly addressing the acceptance of DRS in the context of SAV use
Method
a stated choice survey was conducted and analyzed, using a mixed logit model.
This research draws from an online survey, which was completed by 435 residents of major metropolitan areas of Australia. The survey comprised two parts. In the first part, a questionnaire was presented to survey takers to collect information about socio-demographic characteristics as well as about mobility-related characteristics and behavior. Furthermore, Haustein’s (2012) Likert type attitudinal indicators aimed to obtain measurements for modal preferences. The second stage of the survey featured a stated choice experiment, in which the respondents were asked to indicate whether they would switch to an SAV on a trip they recently undertook.
Modality styles (e.g. Vij et al., 2013) were identified by clustering respondents’ self-reported frequencies of use of the four transport modes car, PT, walking and bicycling, using the k-means algorithm (Hartigan and Wong, 1979). The
Result
The results show that service attributes including travel cost, travel time and waiting time may be critical determinants of the use of SAVs and the acceptance of DRS.
Differences in willingness to pay for service attributes indicate that SAVs with DRS and SAVs without DRS are perceived as two distinct mobility options. The results imply that the adoption of SAVs may differ across cohorts, whereby young individuals and individuals with multimodal travel patterns may be more likely to adopt SAVs.
Discussion
The results of this survey contribute to a growing body of literature on SAV adoption, by substantiating knowledge about the potential users of SAVs. More specifically, the results suggest that service attributes including travel time, waiting time and fares are significant determinants of SAV use and DRS acceptance. Considerable variation of VoT estimates across the alternatives SAVs without DRS and with DRS indicates that the two alternatives are regarded as two distinct mobility options. SAV with DRS are more likely to be selected by young travelers and a strong relationship between an individual’s modality style and the propensity to choose SAVs is revealed. In addition, current carsharing users are relatively more likely to use SAVs with DRS. Respondents, who traveled by car as driver on the reference trip, are relatively more likely to choose the option SAV without DRS, while selecting the option SAV with DRS is more likely if the reference trip was undertaken by car as passenger. Interestingly, switching to any of the hypothetical options is not relatively more likely, if respondents traveled by PT on the reference trip.
Policy implications
Several policy implications can be derived. Overall, the results suggest that the adoption of SAV services will most likely differ across sub-groups and modality may be a major discriminator of sub-group membership. While multi-modal travelers may adopt SAVs to facilitate their multimodality, individuals whose modality is mostly and almost exclusively centered around the use of the private car may be reluctant to use SAVs. Furthermore, market penetration rates may be greater among young travelers. The derived policy implications are complementary to the existing literature, which deals with the policy implications of the AV technology in general (Anderson et al., 2014; Fagnant and Kockelman, 2015a, 2014; Wadud et al., 2016). 5.3.
Some useful information
The AV technology will also dramatically lower the likelihood of accidents so that the insurance primes contained in current carsharing rates could be reduced.
Ride-sharing with conventional vehicles requires users to incur high transaction costs for searching for ride opportunities, for arranging pick-ups and for cost-sharing agreements. In many cases, transaction costs may offset the benefits of ride-sharing. Even if ride-sharing was supported by information and communication technology (ICT), drivers would still need to navigate to the origin and the destination of the passenger for whom a ride opportunity is provided. Furthermore, the applicability of ride-sharing is restricted to cases, where the route between the driver’s origin and destination roughly coincide with the ride-receiving person’s origin and destination. In conjunction with a comprehensive ICT integration, the AV technology and SAVs could resolve the barriers, which currently hinder a greater uptake of ride-sharing.
Empirical evidence suggests that the use of the private car is not only influenced by utilitarian considerations, but also by symbolic-affective motives such as the use of the car as symbol of social status and self-expression as well as feelings of autonomy, freedom and flexibility (Anable and Gatersleben, 2005; Steg, 2005).
DRS heavily relies on user acceptance, as users must be willing to spend some time with a stranger in the confined space of an SAV.
Duarte F, Ratti C. The Impact of Autonomous Vehicles on Cities: A Review[J]. Journal of Urban Technology, 2018: 1-16.
Good writing.
Motivation
AVs have the potential to become a major catalyst for urban transformation.
Research question
To explore some of these transformations,
first, we discuss the possibility of decoupling the many functions of urban vehicles from the form factor (without drivers, do cars need to look like they look today?).
Second, we question whether AVs will lead to more or fewer cars on the roads, highlighting the synergies between AVs and ride- sharing schemes.
Third, with AVs as part of multimodal and sharing- mobility systems, millions of square kilometers currently used for parking spaces might be liberated, or even change the way we design road space.
Fourth, freed from the fatigue related to traffic, we question whether AVs would make people search for home locations farther from cities, increasing urban sprawl, or would rather attract more residents to city centers, also freed from congestion and pollution.
Fifth, depending on responses to the previous questions and innovative traffic algorithms, we ask whether AVs will demand more or less road infrastructure.
Will AVs Look Like Cars as We Know Them?
AVs open up the possibility of decoupling the uses of a moving platform from the established shape of a car.
More or Fewer Cars on the Road?
As Stanford (2015) shows, this has been the battle between individual and collective modes since the introduction of cars in the early Twentieth Century. Regard- less of how smoothly AVs can negotiate traffic without risks of collision and frequent stops at intersections, the fleet of AVs required to replace a simple subway train would clog urban roads.
More or Fewer Parking Spaces?
Cars are idle 96 percent of their life span, and AVs could have a utilization rate higher than 75 percent (“If Autonomous Vehicles Rule the World,” 2015).
More or Less Urban Sprawl?
More or Less Road Infrastructure?
Petit J, Stottelaar B, Feiri M, et al. Remote attacks on automated vehicles sensors: Experiments on camera and lidar[J]. Black Hat Europe, 2015, 11: 2015.
Motivation
A fully automated vehi- cle will unconditionally rely on its sensors readings to make short-term (i.e. safety-related) and long-term (i.e. planning) driving decisions. In this context, sensors have to be robust against intentional or unintentional attacks that aim at low- ering sensor data quality to disrupt the automation system.
Indeed, any attack that degrades sensor data can cause false driving reaction
Research goal
This paper presents remote attacks on camera-based system and LiDAR using commodity hardware.
Attacker model
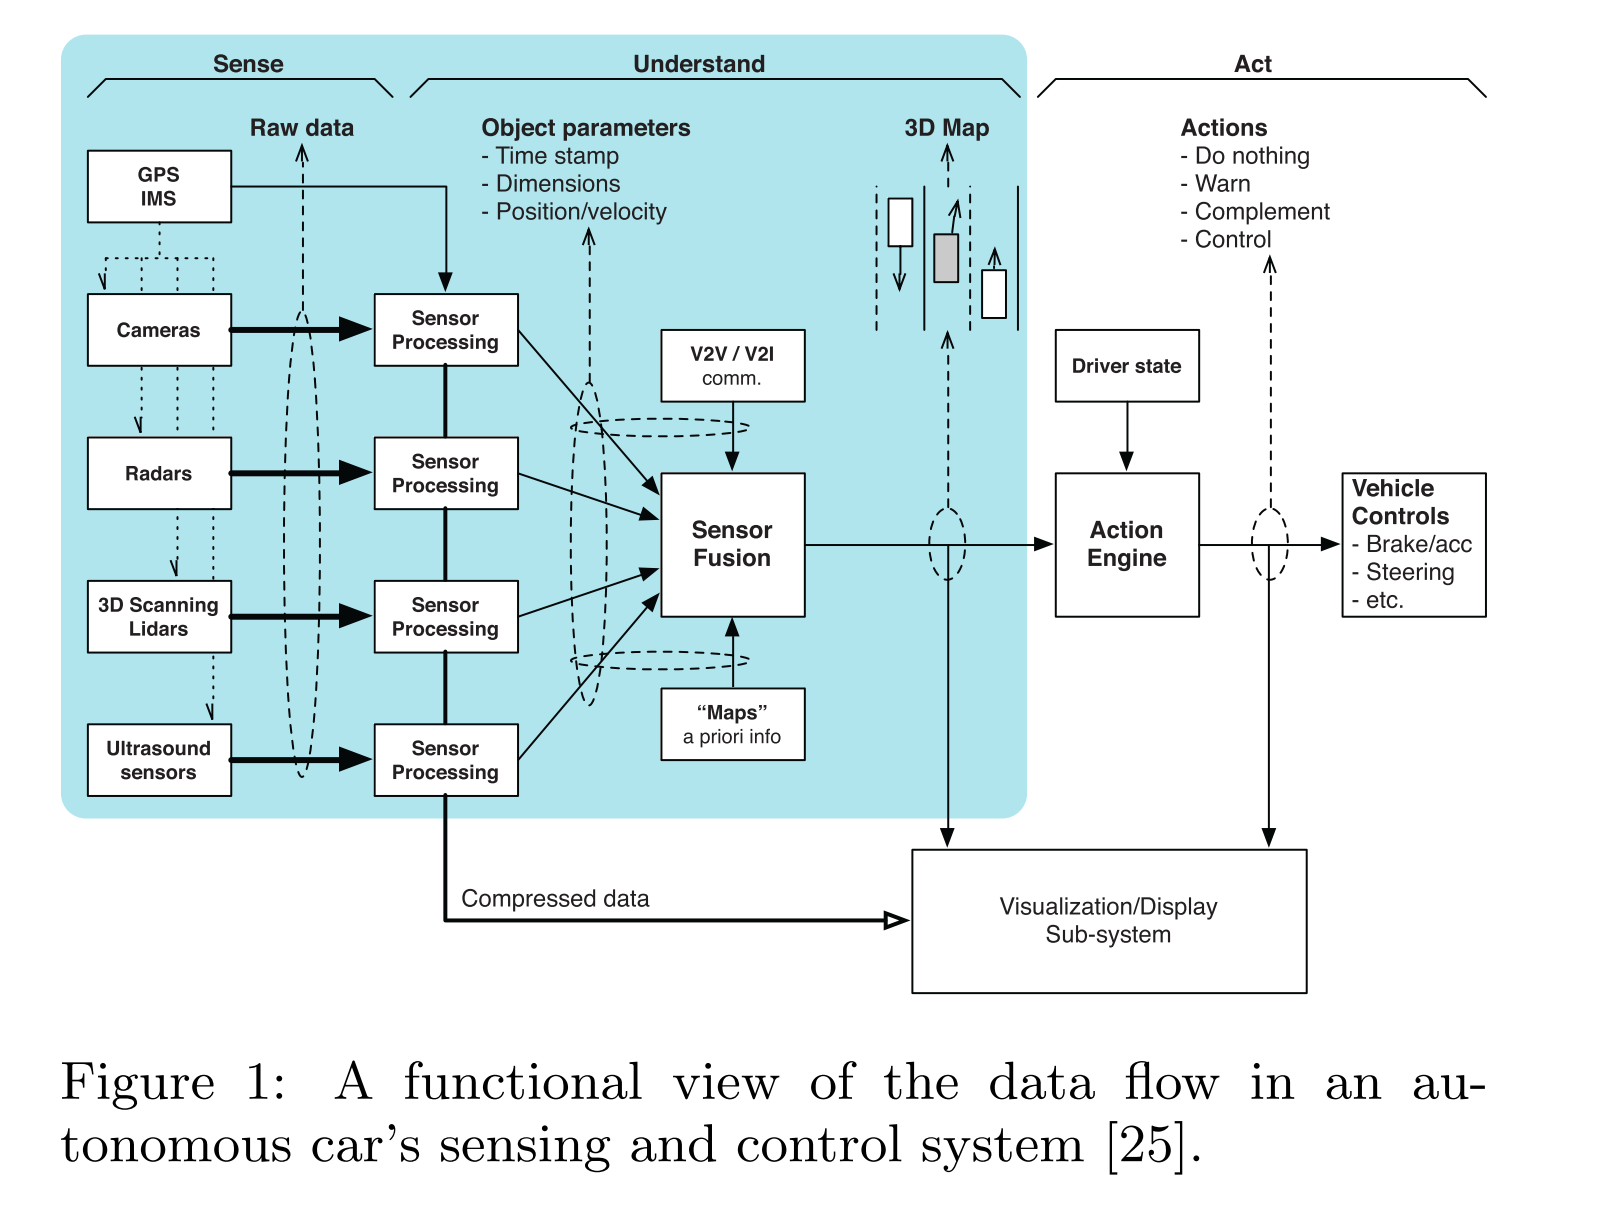
Front/rear/side attack In a front/rear/side attack, the attacker installs the required hardware to mount an attack in another vehicle. Depending on the hardware, this can be installed without anyone noticing. The vehicle is then used to drive in front of (or behind of, or next to) the target vehicle. When positioned, the attack is executed once or multiple times. The advantage of this attack scenario is that it allows an attacker to keep the same distance to the target AV for a longer period.
Roadside attack A roadside attack is mounted stationary in objects on the side of the road, such as the guard rail. The attack is not limited to one installation point, but can be spread over multiple installation points, potentially connected to each other (e.g. for replay or relay attacks).
Evil mechanic attack The ‘Evil Mechanic’ [28] has shortterm physical access to the vehicle, e.g. when it is parked or left for maintenance. For instance, an at- tacker can mount a jamming device on a (carrier) ve- hicle that jams other vehicles unknowingly.
ATTACKS ON CAMERA
Blinding the camera
Blinding occurs when the camera is not able to tune the auto exposure or gain down anymore.
Three variables have direct impact on the effective- ness of the blinding attack. The first variable is the en- vironmental light. If the camera is positioned in a bright environment, the auto controls are adapted for that partic- ular environment, so more light would be needed to raise above the environmental light to reach a blind state. The second variable is the light source used to blind (i.e. wave- length), and the third variable is the distance between the light source and the camera.
Confusing the auto controls
Countermeasures
- Redundancy
- Optics and materials
ATTACKS ON LIDAR
Relaying the signal
Spoofing the signal
Countermeasures
- Redundancy
- Random probing
- Probe multiple times
- Shorten the pulse period
Result
Results from lab- oratory experiments show effective blinding, jamming, re- play, relay, and spoofing attacks. We propose software and hardware countermeasures that improve sensors resilience against these attacks.
Contribution
In this paper, we present attacks on camera and LiDAR systems. As we think the most realistic type of attacker will be outside of the target vehicle, we only con- sider remote attacks. To assess the feasibility and sophisti- cation of the attacks, we only use commodity hardware (be- low 60 US$) and perform black-box attacks. Results show successful blinding, jamming, replay and spoofing attacks in different laboratory conditions.
Ryder B, Gahr B, Egolf P, et al. Preventing traffic accidents with in-vehicle decision support systems-The impact of accident hotspot warnings on driver behaviour[J]. Decision support systems, 2017, 99: 64-74.
Motivation
Despite continuous investment in road and vehicle safety, as well as improvements in technology standards, the total amount of road traffic accidents has been increasing over the last decades. Consequently, identi- fying ways of effectively reducing the frequency and severity of traffic accidents is of utmost importance. In light of the depicted challenge, latest studies provide promising evidence that in-vehicle decision sup- port systems (DSSs) can have significant positive effects on driving behaviour and collision avoidance.
Going beyond existing research, we developed a comprehensive in-vehicle DSS, which provides accident hotspot warnings to drivers based on location analytics applied to a national historical accident dataset, composed of over 266,000 accidents.
Contribution
The contribution of the paper can be summarised as follows:
-
The in-vehicle DSS that we developed is, to the best of our knowledge, the first of its kind, i.e. incorporating automati- cally generated accident hotspot warnings as an alternative to human selected locations or up-coming collision warnings.
-
The system is one of the first in-vehicle warning systems to be tested in real world conditions across a longitudinal field study, providing evidence of an improvement on driver behaviour over time.
-
Due to the integration ofcommonly collected accident location details, the proposed DSS can be easily extended to other parts of the world where such data are compiled, either at a regional or national level.
Barann, Benjamin, Daniel Beverungen, and Oliver Müller. “An Open-Data Approach for Quantifying the Potential of Taxi Ridesharing.” Decision Support Systems 99 (2017): 86–95. doi:10.1016/j.dss.2017.05.008.
Motivation
Taxi ridesharing1 (TRS) is an advanced form of urban transportation that matches separate ride requests with similar spatio-temporal characteristics to a jointly used taxi.
Research work
We develop a one-to-one TRS approach that matches rides with similar start and end points. We evaluate our ap- proach by analyzing an open dataset of N5 million taxi trajectories in New York City. Our empirical analysis re- veals that the proposed approach matches up to 48.34% of all taxi rides, saving 2,892,036 km of travel distance, 231,362.89 l ofgas, and 532,134.64 kg ofCO2 emissions per week. Compared to many-to-many TRS approaches, our approach is competitive, simpler to implement and operate, and poses less rigid assumptions on data avail- ability and customer acceptance.
Ridesharing approaches
There are several advantages connected to TRS. Customers can profit from the same mobility, accessibility, and efficiency as provided by tra- ditional taxis, and from some of the advantages ofpublic transportation [6,10,29]. For example, one advantage is the cost reduction through split fares [6,9,13,14,16,23,30,p. 409]. Furthermore, the overall waiting time in high demand situations can be reduced [6,13,14,30,p. 409]. From a provider’s perspective, TRS increases seat occupancy, reduces the num- ber of taxis required, and enables cutting the cumulative trip length and travel time. In turn, this results in the reduction of operational costs, such as fuel consumption and car depreciation [6,8,9,11,14,23]. Shuo Ma et al. [14] and Sun et al. [30,p. 409] argue that even increased reve- nues may be possible by implementing favorable pricing mechanisms and by better utilizing delivery capacities [14]. Societal benefits include diminishing the negative impacts of taxis on cities by reducing noise and traffic congestion, a reduction ofgreenhouse emission, and less en- ergy consumption [6,9,11,13,14,16,23,30,p. 409].
On the downside, TRS can also lead to disadvantages. First, there may be an increase in the overall service andwaiting time [6,9],leaving passengers concerned about the reliability of TRS [26]. Second, there may be problems related to the privacy and security of traveling with strangers in the same vehicle [9,30,p. 415]. Third, the potential positive environmental effects need to be treated with caution, as the reduced cost of taxi rides could also result in increased demand, or other re- bound effects [31,32].
Approaches towards TRS [6–14,16,23, 28,29] differ regarding the proposed routing patterns, matching con- straints, matching dynamics, and matching objectives. However, most approaches are based on the idea that passengers can embark and dis- embark anytime during a trip.
Research method
Data collection
we analyzed an open dataset collected by the NYC City Taxi & Limousine Commission (TLC), which records data about their taxi fleet operations on a per-trip basis. Taxi trip data fromNYCwas first released and described by DonovanandWork [34].Later the TLC [35] published a more comprehensive dataset, spanning from2009 to 2015 and covering several hundred million trips completed by the yellow and green cab companies (the latter starting from August 2013). The volume of this dataset makes our approach a spatial big data analysis.
Data cleansing
Some trips were conducted outside of the city borders. Therefore, all trips outside a given coordinate range were dropped. The south-western border was set to [40.477399, −74.25909] and the north-eastern border was specified as [40.917577, −73.700009]
There were a few tripswhere the actual trip distance was smaller than this calculated distance, which is geometrically impossible.
trips shorter than 200mwere discarded.
all trips with identical start and end points were dropped [9]. Tripswithunrealistic durations (i.e., trips lasting less than aminute, lon- ger than 2 h, and trips with velocities above 144 km/h, which is 40 km/h above the speed limit of65 mp/h) were dropped.
all trips which had 0 passengers and thosewhichhad a rate_code equal to5 (individual negotiation price) or 6 (group fare on fixed route) were dropped. These data preparation activities removed around 7.3% of all trips in the ordi- nary week (7.14% in the extraordinary week).
Matching constraints
First, the distances between the origins (o) and destinations (d)of the individual trips need to be checked [18]. Two trips should only be matched if the walking distance between their origins is smaller than odist and the walking distance between their destinations is smaller than ddist. Also, we ensured that the total trip distance (tdist) is longer than a portion of the overall walking distance (wdf∗ (odist + ddist)).
Second, matched trips need to start at approximately the same time [21]. We added a time-window constraint that specifies the time be- tween the trip announcement and the latest possible departure time (timeWindow). To ensure that customers would arrive on time (arrivalTime ≤ latestDepartureTime), the approximate walking time be- tween the pickup points was calculated and added to the difference. While other TRS approaches define a constraint on the maximum delay in trip duration or the actual drop-off time [6,9,11,13,14],aone- to-one approach as presented here does not require this extra con- straint, since by definition shared trips end at approximately the same destination and time. Since the walking time to the drop-off location is already bounded by the distance constraint and a constant walking speed is assumed, an additional constraint is not required.
Third, our approach also considers the capacity of taxis (carCapacity). While the car capacity may vary in reality, a fixed car size was assumed. As stated by D’Orey et al. [6] and the TLC [45], the maximum taxi capacity in NYC is five, which we used to restrict the number of combined passengers in a shared ride (sum(passengerAmount)). Similar to Chen et al. [8] and Santi et al. [9], another constraint defines the maximum number of individual trips (maxTripShare) that can be shared in a single ride (e.g. pairwise, triple, or quadruple matches). We did not consider personal constraints such as smoking attitudes or gender, as suggested by Lalos et al. [23],Santos and Xavier [16] and Tao andWu [28], since our dataset did not provide these attributes.
Fourth, we designed a simple and easy-to-understand pricing mechanism that evenly splits the cost of a shared ride between the partici- pants. To prevent that the reduction of individual rides had a negative impact on the operators’ and drivers’ incomes, we added a constant sharing surcharge that needs to be paid by each passenger. Similar to the approach ofShuoMa et al. [14], this simple pricing schemeprovides taxi companies anddriverswithmore profit per ride, while reducing the expenses for individual passengers. Other TRS approaches either ensure that trips are profitable, that the price paid is smaller than the price of the original trip, or that the price is high enough to pay the driver [7, 11,13,16].
we assume that a rider is only willing to host a shared trip if a single match (tripAmount = 2) is enough to reduce his/her individual costs. Comparable to this, a rider would only be willing to join a shared ride if the current amount of matched rides (tripAmount) is high enough to reduce his/her expenses (individualCosts).
Fifth, only trips that ended at the same destination without long de- tours to intermediate destinations were matched. Hence, a distance de- viation constraint (dd) was added that checks the differences between the individual trip lengths. Without this check, unrealistically profitable trips would be merged, biasing the analysis results.
Matching process
all tripswere analyzed in chrono- logical order, using a greedy first-come-first-served (FCFS) heuristic.
Overall, our trip matching process can be divided into four phases (Fig. 2):
- Initialization: this step ensured that the prerequisites of the algo- rithm, such as clearing old cached results, preparing the input and output data structures, and initializing algorithm components—such as a spatial index for the pick-up locations—were met.
- Loop over unmatched riders: we considered eachunmatched rider as a potential host for a shared trip. Therefore, we processed the trips in ascending order oftheir pick-up times. In this step, we used a spatial index to approximate the pick-up distance constraint and thus, opti- mized the search strategy. This method was inspired by the idea of national grid reference systems [46] and can be compared to a sim- plified version of the “lazy shortest path calculation” presented by Shuo Ma et al. [14]. With this approach, we restricted the distance calculation and the check ofthe other constraints to a quickly identi- fied narrow set ofmatching candidates.
- Loop over potential matching candidates: for each matching candi- date we checked the constraints explained before (including the pick-up distance constraint). If all constraints were satisfied, we added the matching candidate to the trip of the host.
- Return the overall matching results: in the last phase, we evaluated and stored the result data structure containing the shared rides for further analyses.
Data analysis and results
Reference scenario
The data indicate that a considerable number of trips can be shared (48% for the ordinary week and 43% for the extraordinary week), resulting in a substantial ride reduction (753,860 rides for the ordinary week and 497,734 rides for the extraor- dinary week).
What-if analysis
Influence of the distance constraint
Influence ofthe length ofthe time window
Influence ofcar capacity
Influence ofmulti-ridesharing approaches
Influence ofsharing surcharges
Influence ofweek days and time ofday
Influence ofpick-up and drop-off locations
Contribution
From a decision-support perspective, our proposed approach and our empirical results contribute to enhancing the decision-making of actors at various levels.
First, the proposed approach enables taxi operators to estimate the feasibility of one-to-one taxi ridesharing for a given city and various scenarios. The conceptual framework presented here can easily be instantiated to form the backbone of a decision support system that allows for calculating the overall economic potential of taxi ridesharing as well as for conducting detailed what-if analyses.
Second, our approach and empirical results can inform policy making related to urban transportation. Policy makers with access to taxi trip data, for example, national or local transportation authorities, can use the approach presented here and replicate our analyses to support decisions regarding sustainable urban transportation (e.g., subsidizing taxi ridesharing).
Third, our findings may convince individual customers of the potential of taxi ridesharing and thereby influence their decision making related to whether to use existing taxi ridesharing systems or not.
Pick J B, Turetken O, Deokar A, et al. Location Analytics and Decision Support: Reflections on Recent Avancementa, a Research Framework and the Path Ahead[J]. Decision Support Systems, 2017, 99.
Research goal
The goal of this special issue is to present explorations and knowledge enhancement on the cutting edges of decision making involving location and place.
2. Location analytics and decision support: synopsis of extant research
Location analytics (LA) refers to the contemporary concept of using specialized spatial analysis techniques to understand spatial arrangements, patterns, groupings and relationships in geographically referenced phenomena. Methods include overlays, buffers, hot spot analysis, spatial cluster analysis, spatial autocorrelation, proximity poly- gons, spatial econometrics and other techniques.
Non-location analytics (NLA) refers to analytics methods that do not include spatial dimensions, such as non-spatial statistics, forecasting, optimization, sensitivity analysis, multi-criteria evaluation, simulation, and data mining.
2.1 The problem areas and research questions Roughly
Roughly half of the studies concern solving problems in transportation/routing, location siting, and urban issues (see Table 1).
Other problems include:
1) gaining understanding of the cognitive aspects of LA/ NLA/DS,
2) conceiving conceptual theory and frameworks for LA/NLA/ DS,
3) designing a geospatial information utility for LA/NLA/DS,
4) designing spatial decision support for disruption of links in critical national infrastructure,
5) developing structural theory and testing of locational privacy issues with application to marketing decisions,
6) predicting small business failures using social media locational data,
7) developing an integrated predictive model of human mobility and movement intention based on a person’s GPS trajectories [7,8,25,32,35,41].
The research questions underpinning these studies mostly concern how to construct LA/NLA/DS models, what are the implications of the results of empirical applications, and what is learned from experimental outcomes.
2.2 Methodologies
In the papers that focus on constructing SDSS, methods include optimization techniques such as bi-objective optimization [17], network optimization [30], and capacitated location routing with sequential heuristics [24].
Several studies utilized statistical models including a logit model to predict business failure [39], structural equation modeling to estimate locational privacy [35], and a hedonic pricing model [21], while experimental designs were used to assess cognitive and behavioral aspects of LA and DS [8].
On the spatial side, some studies used descriptive spatial analysis of point locations and polygons, while several studies used more sophisticated GIS methods including 3-D display [42], geographical flow diagrams with flowlines [33], and multi-layer urban mapping [11].
2.3 Location analytics content
A literature review study ofleadingMIS journals showed that the location analytics side of this special issue’s research focus has trailed the more heavily researched non-location analytics side [10].
The classification has the following four levels:
- Spatial data manipulation. This is an elementary use of locational analysis that simply produces the raw geographic information; sometimes referred to as “dots on a map,” because the dots as raw data are not further organized or elaborated on to become informa- tion or knowledge [27]. Spatial data manipulation does not have a lo- cation analytics component.
- Spatial data analysis. This is more descriptive than Level 1, and often exploratory. Techniques of spatial analysis are used [22,23,27] in- cluding overlays, buffering, spatial autocorrelation, hotspot analysis, proximity polygons, 3-D, rastering, location quotients, Huffmodel- ing, and spatial econometrics. Spatial data analysis considers the geospatial and geometric relationships of the mapping elements. For instance, layering includes analyzing the relationship of one mapping layer (e.g., a layer of locations of distribution centers) with another mapping layer (e.g., a layer of zip code polygons).
- Spatial statistical analysis. At this level, data are used in estimating a statistical model or solvable optimizationmodel that recognizes spa- tial properties [2,6].
- Spatial modeling. This level uses heuristics, simulations, and com- bined methods in an integrated model that are expressed spatially. The goal is to answer questions such as can the model express geo- graphic flows of persons and material objects, optimize the location ofbusiness offices and facilities, or simulate real world complex loca- tional environments and situations [26]. Spatial modeling goes be- yond the solvable spatial statistical models in step 3 and consists of deterministic or stochastic modeling and simulation that includes spatial elements.
Referring to the articles in Table 1, thirteen are at Level 2, three at Level 3 and nine at Level 4.
2.4 Non-location analytics and decision support content
A majority of previous work on location analytics and decision support also incorporated non-location related components such as the un- derlying (non-locational) research problems, data utilized and/or generated, and non-locational analytics methodology. As examples of non-locational components in this collection of articles, [35] tackled the popular bankruptcy prediction problemusing location-tagged social media along with more typical business characteristics previously used in failure prediction, while [21] predicted hotel room rates using both facility and location data. In other examples, Gerber [14] used Twitter data, which has both location and non-location content in crime prediction, and [36] predicted service rate of a seaport using mostly geo-spatial data. The non-location data used in this body of work consisted of customer demographics and store characteristics [9], hotel facilities, roomamenities, andhotel categories [20], prices and restaurant ratings [35], and textual content of tweets [14].
Another subset of the reviewed research used non-location data and non-locational analytics techniques in addressing location problems. For example, [32] used client income, service fees, and equipment costs in a binary optimization model to determine optimal placement of wireless towers in a rural county in mid –Atlantic USA. Customer demand, vehicle capacity [24,31], vehicle size andweight [30], and facility (depot) capacity [24] alongwith location data have been used in vehicle route optimization problems. Johnson [20] introduced a system that used landlord, building and individual unit data along with multi criteria decision making (ranking) techniques for support in neighbor- hood selection by clients in the Section 8 Housing Choice Voucher Program.
2.5 Types of relationships between location analytics, non-location analytics and decision support
The dimensions of integration we propose are:
(a) conceptual integration,
Conceptual integration occurs when the design of an SDSS does not uncouple and separate the GIS/spatial module from that of the non-spatial analytics and decision support. A study at this level might be one that conceptualized the integration ofGIS withmar- keting information systems.
(b) algorithmic/software integration,
Algorithmic/software integration refers to al- gorithms that unite the LA and NLA computations in the software. An example ofalgorithmic integrationwould be a predictivemodel was de- veloped to predict crime through an algorithm that includes neighbor- hood places and Twitter-specific topics.
(c) integration as it appears to the user
Integration based on Appearance to Users occurs if the user is provided a unified, integrated interface of the LA, NLA, and DS interactivity and displays. In some studies, even though LA is conceptualized as a separate part of a broader model and kept apart in the software, to the user themodel appears integrated. An example would be a model of spatial decision support for disruption of critical network nodes comprised six separate analytical parts conceptually and algorithmically, but the user was seamlessly able to view an integrated dashboard showing mapping, graphics, and tables in the same display, without being aware of the conceptual and algorithmic separation of LA, NSA, and decision support.
2.6 Empirical testing ofalgorithms, systems, or approaches Empirical
80% of the articles examined report empirical testing.
3. A research framework for locational analytics and decision support
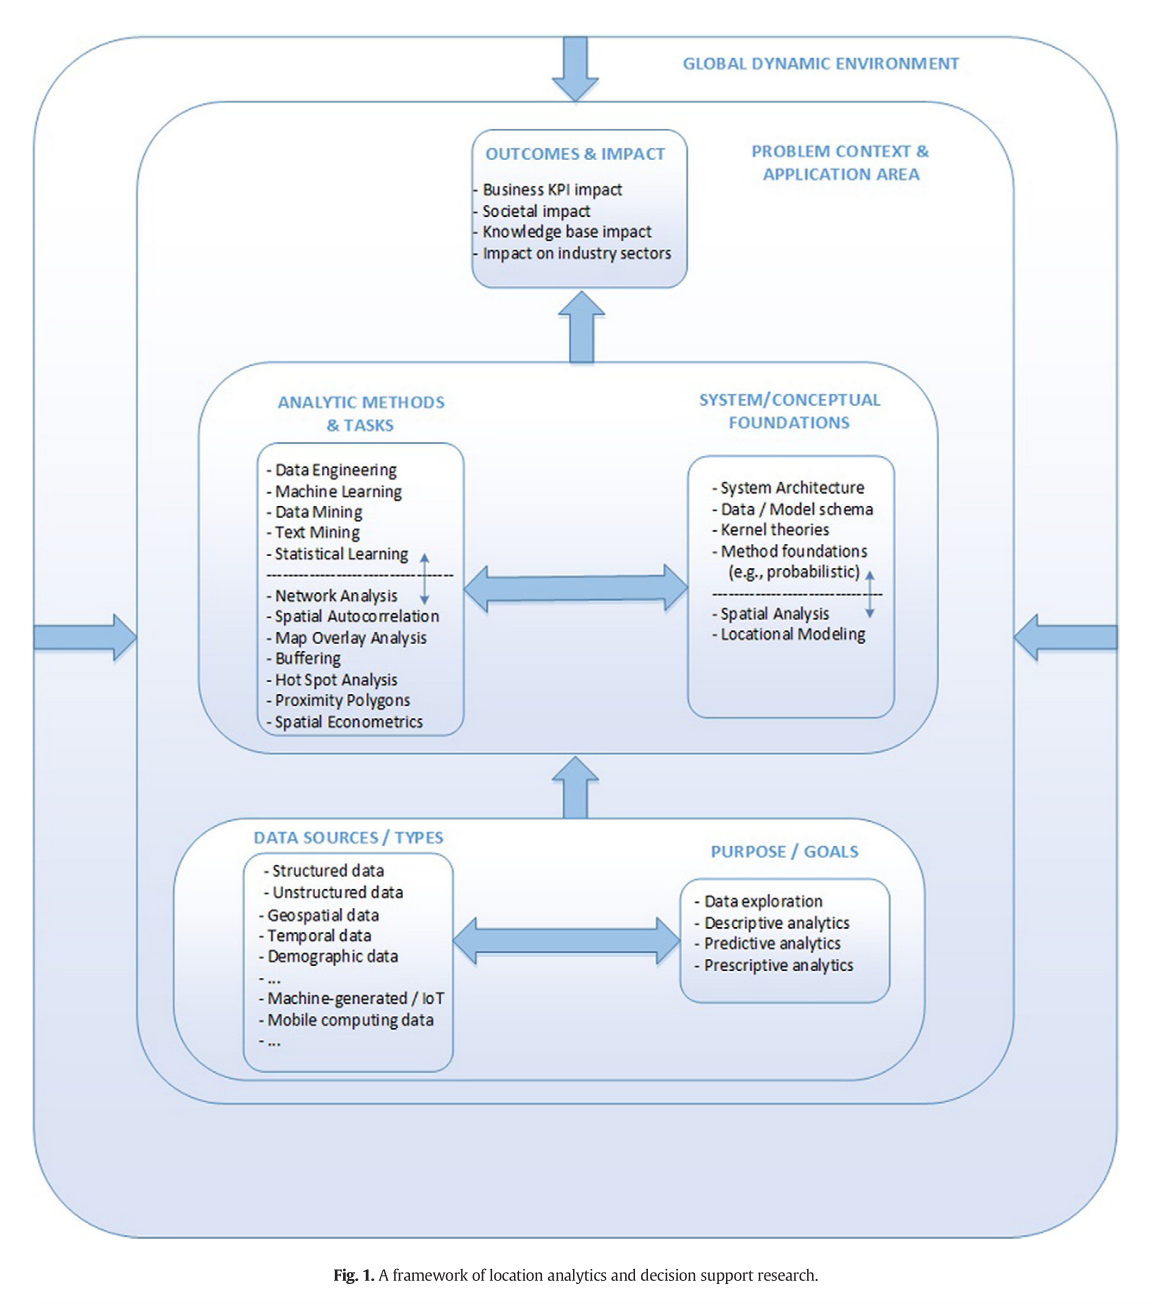
5. Trends in location analytics anddecision support, gaps, and future directions
5.1 Trends in location analytics and decision support in MIS research Location
With greater availability of georeferenced data, we anticipate research into predictivemodeling ofgeospatial phe- nomena, such as spatial patterns ofdiffusion ofinformation, knowledge, topics, consumer trends, lifestyles, disease, crime, and customer de- mand, to be on the fast track.
5.2 Gaps which lead to prospective future research
One gap that has future potential is research on LA/NLA/DS which expands the variety of geographic and spatial techniques (see Section 2.3).
Another area of future poten- tial is to continue the trend noted in Sections 2.5 and 4 of stronger integration of LA, NLA, and DS. There are synergies in doing this that can potentially lead to more powerful, efficient models and tools.
El-Geneidy A, van Lierop D, Wasfi R. Do people value bicycle sharing? A multilevel longitudinal analysis capturing the impact of bicycle sharing on residential sales in Montreal, Canada[J]. Transport Policy, 2016, 51: 174-181.
Motivation
Many studies have aimed to assess the impacts of major transportation investments, such as freeways expansions and light rail presence on property value. Yet, few studies have attempted to understand the impact of active transportation investments on housing prices.
Research question
This study attempts to understand the relationship between a new bicycle sharing system and home sale prices in Montreal, Canada.
Data and methodology
the present study uses a hedonic regression analysis based on a sample of repeated housing sales in Montreal, Canada, to explore the factors influencing the sale prices in the region.
this study includes Walk Score data to control for some neighborhood characteristics and local accessibility.
Other control variables are included in the model such as the structural and spatial attributes of properties, and the avail- ability of transportation services.
Data from the Multiple Listings Service (MLS) of Montreal, Canada, is used to generate the hedonic model. In the period be- tween 1996 and 2012 a total of440,965 home sales are recorded in the system.
Result
Our results show that the presence of a bicycle sharing system in a neighborhood with 12 stations serving an 800-meter buffer is expected to increase the property value for units in multifamily housing by approximately 2.7 percent.
Contribution
Policy makers wishing to improve the local urban environment while benefiting from economic gains can work on increasing the availability of bicycle sharing systems as this will likely result in increasing property values, improved neighborhood health, and a more vibrant urban environment.
Wang L, Gopal R, Shankar R, et al. On the brink: Predicting business failure with mobile location-based checkins[J]. Decision Support Systems, 2015, 76: 3-13.
Motivation
Mobile-enabled location-based services are generating a huge amount of customer checkin data every day. It is vital to understand how small businesses, like restaurants, use this real-time data to make better-informed business operation decisions in this mobile marketing era.
Research goal
we aim to find out the predictive power of customer checkins on business failure of restaurants in New York City by using several predictive modeling techniques, such as Neural Network, Logit model and K-nearest neighbor.
in this paper we investigate whether the accuracy of predictions about retailers business performance can be significantly improved using checkin data.
This paper addresses the following research questions:
(1) can we use checkin information captured fromlocation-based services tomake a better prediction on business performance?
(2) If yes, by howmuch can we improve our prediction compared to a prediction without such information?
Result
Our findings are encouraging. The customer checkin data from both a focal restaurant and its neighbors have shown strong predictive power on business failure. Compared to the baseline model in which we only use business characteristic variables to predict failure, incorporating the checkin data captured from location-based services gives a remarkable improvement on predictive accuracy.
Contribution
Our findings provide the foundation for future studies on the predictive power of information obtained from location-based services on business operations.
Clewlow R R, Mishra G S. Disruptive transportation: The adoption, utilization, and impacts of ride-hailing in the United States[J]. University of California, Davis, Institute of Transportation Studies, Davis, CA, Research Report UCD-ITS-RR-17-07, 2017.
Research goal
The purpose of this report is to provide early insight on the adoption of, use, and travel behavior impacts of ride-hailing.
Adoption of Ride-Hailing
• In major cities, 21% of adults personally use ride-hailing services; an additional 9% use ride- hailing with friends, but have not installed the app themselves.
• Nearly a quarter (24%) of ride-hailing adopters in metropolitan areas use ride-hailing on a weekly or daily basis. • Parking represents the top reason that urban ride-hailing users substitute a ride-hailing service in place of driving themselves (37%).
• Avoiding driving when drinking is another top reason that those who own vehicles opt to use ride-hailing versus drive themselves (33%).
• Only 4% of those aged 65 and older have used ride-hailing services, as compared with 36% of those 18 to 29.
• College-educated, affluent Americans have adopted ride-hailing services at double the rate of less educated, lower income populations.
• 29% of those who live in more urban neighborhoods of cities have adopted ride-hailing and use them more regularly, while only 7% of suburban Americans in major cities use them to travel in and around their home region.
• Among adopters of prior carsharing services, 65% have also used ride-hailing. More than half of them have dropped their membership, and 23% cite their use of ride-hailing services as the top reason they have dropped carsharing. Vehicle
Vehicle Ownership and Driving
• Ride-hailing users who also use transit have higher personal vehicle ownership rates than those who only use transit: 52% versus 46%.
• A larger portion of “transit only” travelers have no household vehicle (41%) as compared with “transit and ride-hail” travelers (30%).
• At the household level, ride-hailing users have slightly more vehicles than those who only use transit: 1.07 cars per household versus 1.02.
• Among non-transit users, there are no differences in vehicle ownership rates between ride- hailing users and traditionally car-centric households.
• The majority of ride-hailing users (91%) have not made any changes with regards to whether or not they own a vehicle.
• Those who have reduced the number of cars they own and the average number of miles they drive personally have substituted those trips with increased ride-hailing use. Net vehicle miles traveled (VMT) changes are unknown. Ride-hailing.
Ride-hailing and Public Transit Use
• After using ride-hailing, the average net change in transit use is a 6% reduction among Americans in major cities.
• As compared with previous studies that have suggested shared mobility services complement transit services, we find that the substitutive versus complementary nature of ride-hailing varies greatly based on the type of transit service in question.
• Ride-hailing attracts Americans away from bus services (a 6% reduction) and light rail services (a 3% reduction).
• Ride-hailing serves as a complementary mode for commuter rail services (a 3% net increase in use).
• We find that 49% to 61% of ride-hailing trips would have not been made at all, or by walking, biking, or transit.
• Directionally, based on mode substitution and ride-hailing frequency of use data, we conclude that ride-hailing is currently likely to contribute to growth in vehicle miles traveled (VMT) in the major cities represented in this study.
Greenwood B N, Wattal S. Show Me the Way to Go Home: An Empirical Investigation of Ride-Sharing and Alcohol Related Motor Vehicle Fatalities[J]. MIS quarterly, 2017, 41(1): 163-187.
Motivation
While significant debate has surrounded ride-sharing, limited empirical work has been devoted to uncovering the societal benefits of such services (or the mechanisms which drive these benefits).
Research question
In this work, we investigate how the entry of ride-sharing services influences the rate of alcohol related motor vehicle fatalities.
Results
Results indicate four notable findings.
First, while the entry of Uber X strongly and negatively affects the number of motor vehicle fatalities, limited evidence exists to support previous claims that this occurs with the Uber Black car service as well (indicating that prior claims about the efficacy of ride-sharing, specifically Uber, may have been overstated; Badger 2014)).
Second, results indicate that the time for such effects to manifest is nontrivial (upwards of 9 to 15 months)
Third, results suggest no effect of entry when surge pricing is likely in effect, thereby underscoring the importance of cost considerations.
Fourth, results indicate no negative effect of entry on the rate of non-alcohol related motor vehicle fatalities (suggesting that the potential spike in automobiles on the road is not negatively affecting other drivers).
Contribution
Theoretically, these results add interesting nuance to extant understanding of the sharing economy. To the extent that researchers have proposed the sharing economy as a viable alternative to established firms in many markets—for example, AirBnB for hotels (Edelman and Luca 2014) and the crowdfunding of nascent ventures (Burtch et al. 2013)— our results highlight the importance of cost considerations in resolving such market failures. While it is plausible that increased access to services, regardless of cost, would allow consumers to price point differentiate based on their own needs, a preference of consumers toward established pro- viders as costs increase is suggested. Further, to the degree that our results underscore the beneficial effects of ride- sharing services, inasmuch as considerable public welfare losses in the form of motor vehicle fatalities are avoided, this work informs the ongoing policy debate. Finally, this work contributes to the small, but growing, stream of literature discussing both the societal impacts of electronic platforms (Burtch et al. 2013; Chan and Ghose 2014; Greenwood and Agarwal 2016; Seamans and Zhu 2013) as well as the need to conceptualize IT services as a core aspect of the IS field (Alter 2010). To the degree that platforms have been found to both enhance and diminish public welfare, our work con- tributes by drawing a richer picture of the public welfare implications of platform introduction and how these services are driving commerce.
Deodhar S J, Subramani M, Zaheer A. Geography of online network ties: A predictive modelling approach[J]. Decision Support Systems, 2017, 99: 9-17.
Motivation
Internet platforms are increasingly enabling individuals to access and interact with a wider, globally dispersed group of peers. The promise of these platforms is that the geographic distance is no longer a barrier to forming network ties. However, whether these platforms truly alleviate the influence ofgeographic distance remains unexplored.
Research Question
A few recent studies have examined this issue [10] suggesting that distance adversely influences frequency and magnitude of dyadic ties in online context as well. Our study extends this literature in at least two ways.
First, we isolate the extent to which geographic distance predicts the occurrences of dyadic ties by comparing its predictive power with that of the competing distance measures. Such an approach is necessary because a standard online platform does not directly provide geographic distance as an information cue to its users. Instead, it makes each user’s nationality and other location information visible to other users. Therefore, geographic distance is only one of the several distance measures that can predict user’s behavioral response. Any assessment of geographic distance as a predictor of network ties in an online context is incomplete without the inclusion of other forms of distances.
Second, we examine geographic distance in a context that does not follow the two-sided platform structure which is predominant in the extant literature on distance effects in online settings. This difference is relevant to the occurrence of dyadic ties because on two-sided platforms dyadic ties are typically “cross-sided.” Instead, our setting allows any user to form a tie with any other user on the platform, broadening the possible pool of users with whom ties can be established.
In sum, our primary research question is as follows: in a globally distributed network of individuals, in which users can create ties with any other user, whether and to what extent geographic distance predicts the occurrence of dyadic ties?
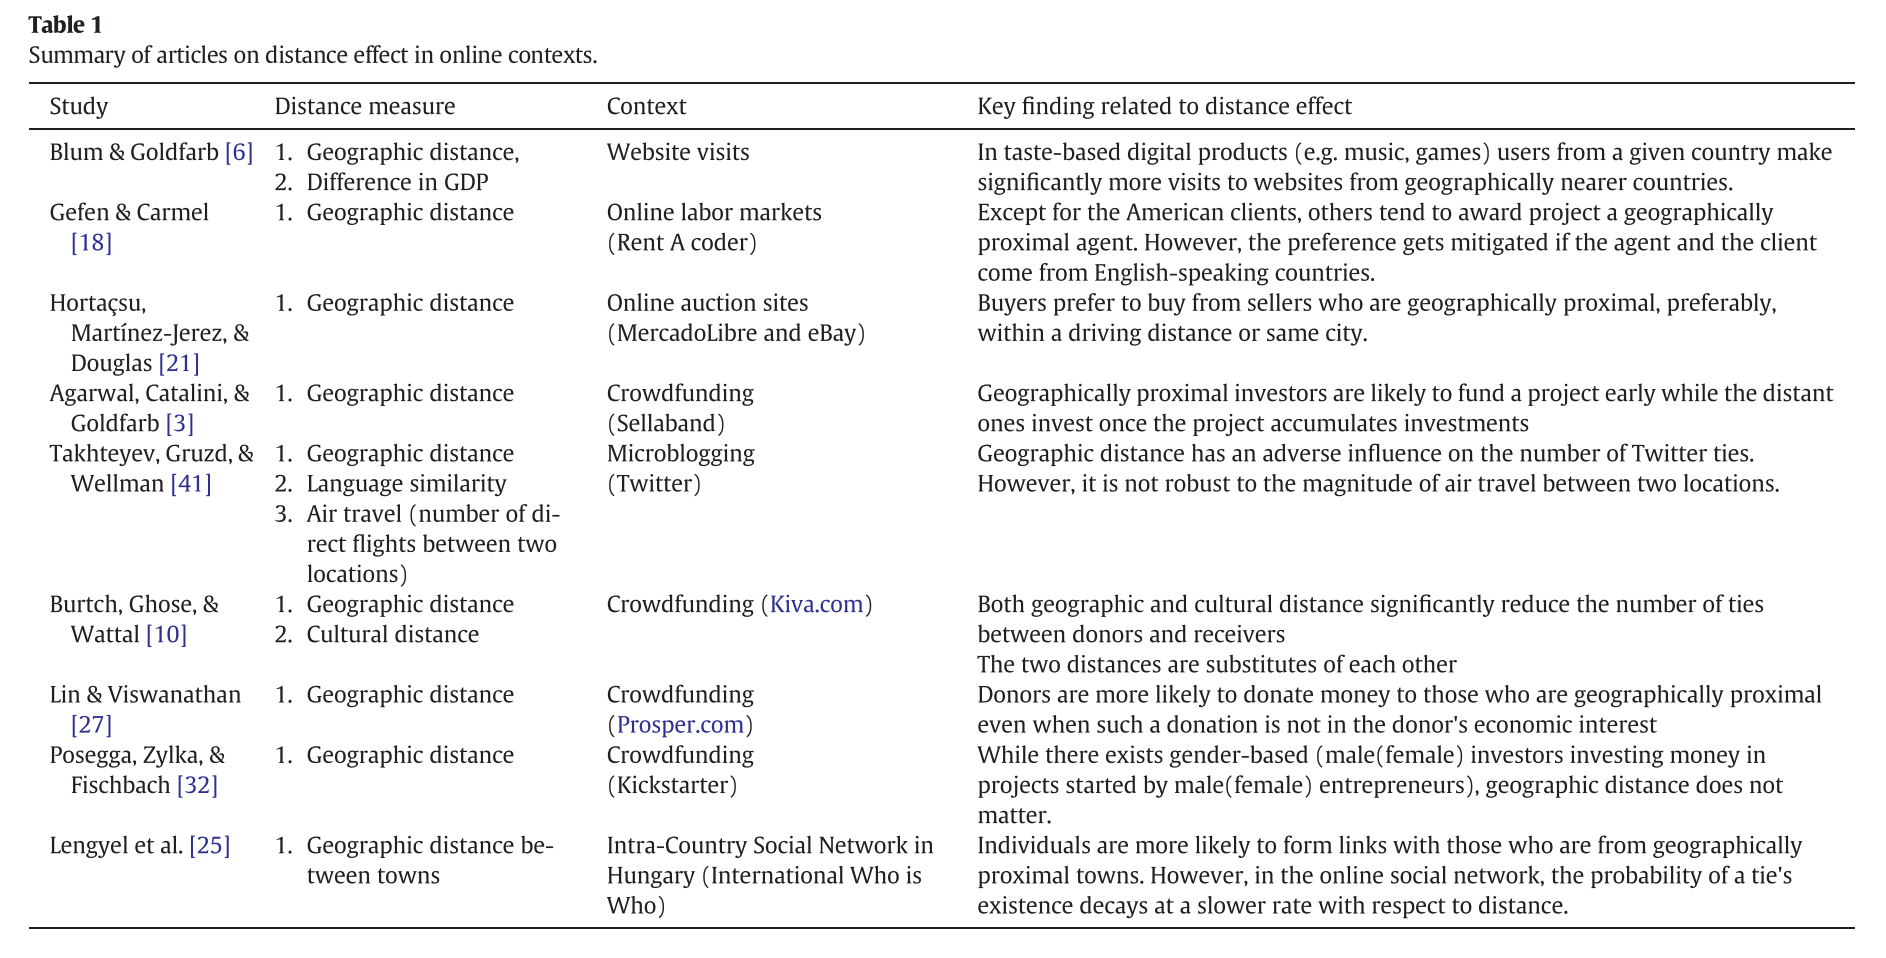
Data
We address this research question by using a dataset of dyadic ties obtained from an electronic investment platform, which we refer to as XTrader. The platform is meant for the currency and commodities trading and has a user-base of over a million traders, representing nearly 100 countries. XTrader is an appropriate choice for our study for several reasons.
First, the platform allows traders to form direct ties with each other. Because all the traders are engaged in the same activity (i.e. trading), there are no distinct sides to the platform. Hence, every trader can form a tie with every other trader.
Second, a trader can create a tie only by allocating a certain portion of their fund to the other trader. That is, each tie that a trader creates has a cost associated with it, allowing us to consider the existence of a tie as a conscious decision on a trader’s part for which the trader is likely to consider available information cues about a potential tie partner.
Third, the platform provides each trader’s country as the only demographic information cue. This cue is publicly visible to everyone. The salience of trader’s nationality enables the distance mechanism to come into play.
Result
Specifically, we determine the extent to which, compared to other types of distances, geographic distance predicts the occurrences of the network ties in country dyads. Using cluster analysis and predictive modelling, we show that not only the geographic distance and network ties exhibit an inverse association but also that geographic distance is the strongest predictor of such ties.
Contribution
our study makes two more contributions.
First, the cluster analysis reveals that the greater geographic distance is associated with fewer occurrences of ties. However, geographically nearer countries are not consis- tently associatedwith the highest count ofties. Apossible explanation is that greater geographic distance may be a sufficient to have fewer ties but lower geographic distance may not suffice to have more ties. That is, while geographic distance may have an overarching association with the count of ties, lack of geographic distance may make other dis- tancemeasures pertinent. Future studies could assess whether this pattern is causal in nature.
Second, the predictive superiority of geographic distance suggests that at an aggregate level, individuals more readily perceive others to be distant/proximal on a geographic distance dimension than on other distance dimensions. This assertion seems somewhat contrary to the explanatory model which suggest that influence of geographic distance on the occurrence ofties is either substitutablewith other distancemea- sures [10] or absent altogether [32]. Therefore, additional work is re- quired to compare the predictive and explanatory models of distance effects in online settings. However, our finding is generally consistent with the extant literature because we find evidence contrary to the “death of distance” hypothesis.
Willing C, Klemmer K, Brandt T, et al. Moving in time and space–Location intelligence for carsharing decision support[J]. Decision Support Systems, 2017, 99: 75-85.
Research goal
In this paperwe develop a spatial decision support systemthat assists free-floating carsharing providers in coun- tering imbalances between vehicle supply and customer demand in existing business areas and reduces the risk ofimbalancewhen expanding the carsharing business to a new city.
Research question
RQ 1: How does carsharing usage vary over time and space, and what drives these variations?
RQ 2: How can FFCS operators decide on the operating area when entering a new city?
Carsharing relocation problem
In general, relocation strategies can be divided into two approaches: operator-based relocation and user-based relocation.
SDSS outline
Location intelligence for existing areas
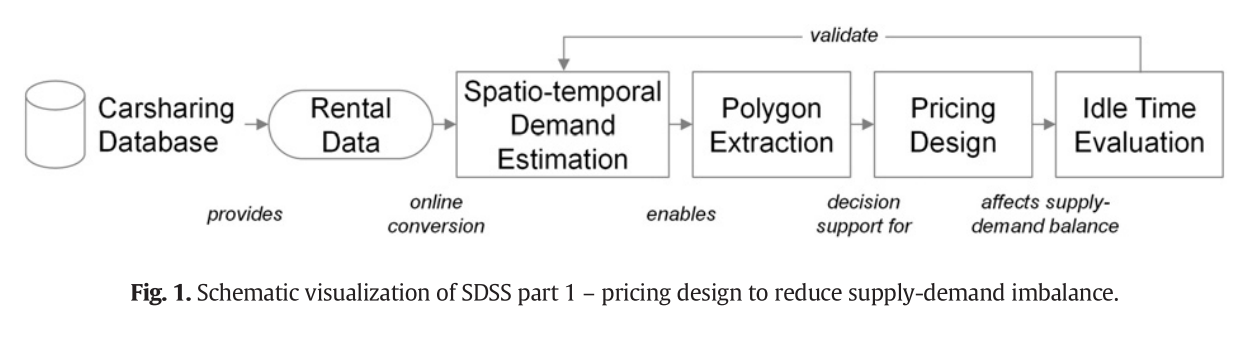
Location intelligence for expansions
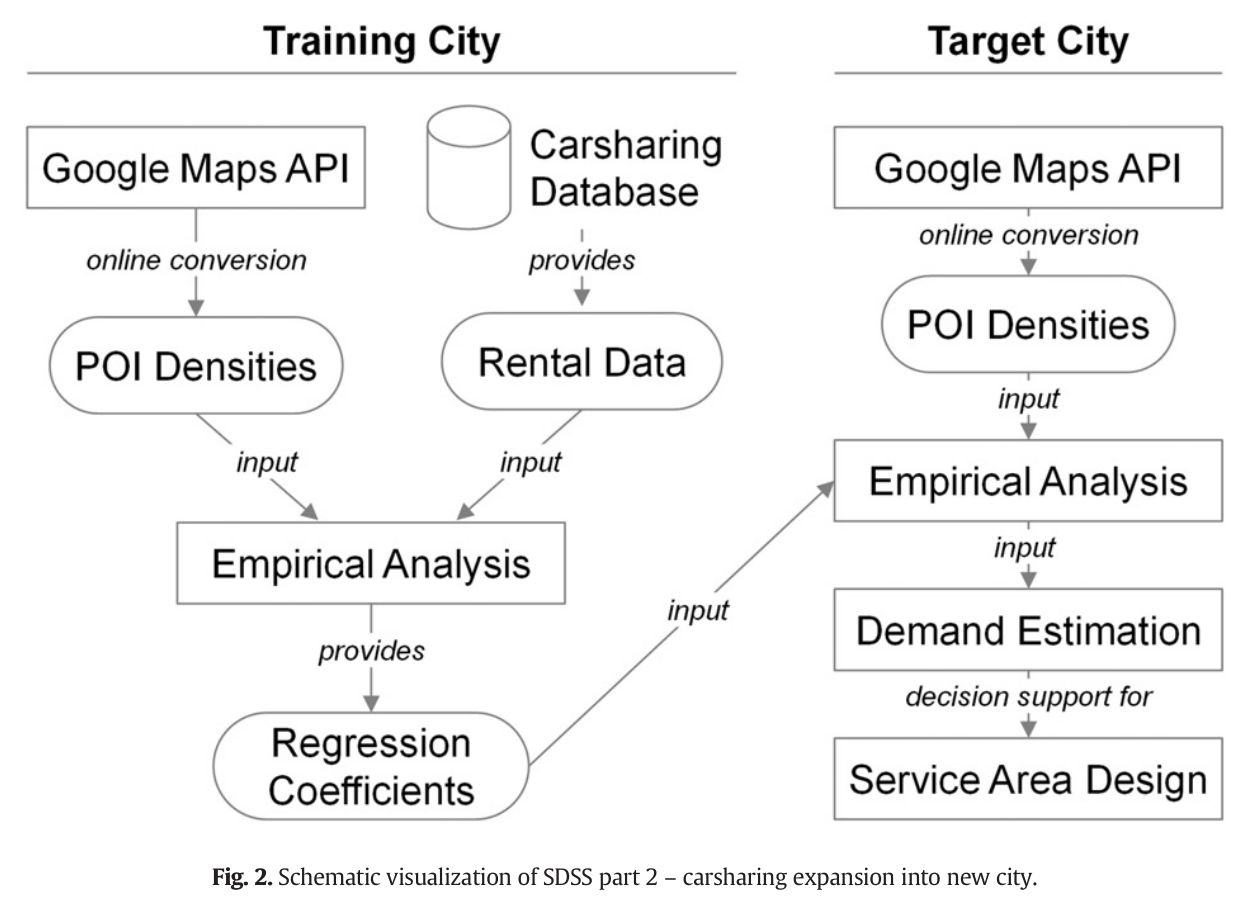
Lozano M G, Schreiber J, Brynielsson J. Tracking geographical locations using a geo-aware topic model for analyzing social media data[J]. Decision Support Systems, 2017, 99: 18-29.
Motivation
Tracking how discussion topics evolve in social media and where these topics are discussed geographically over time has the potential to provide useful information for many different purposes. In crisis management, knowing a specific topic’s current geographical location could provide vital information to where, or even which, resources should be allocated.
Topic models can track trends in a real-time, online fashion where the term “trend” is defined to mean distinct temporal changes that a topic experiences. It does not necessarily indicate popularity, but rather topic evolution. Trend detection and tracking is a very valuable capacity to decision-makers, because it can suggest how to best allocate limited resources.
Research Goal
The study presented herein has served to design and evaluate a model for tracking online discussions with regard to geographic correlation over time. Textual-based geographical locations are ambiguous and therefore inherently contextual, and context is also difficult to model since texts can have complex semantics. The challenge is therefore not only to recognize places, but also to disambiguate them while in the presence of words related to a complex configuration of topics.
2. Background
2.1 Geographical awareness
Geographic location extraction in text
2.2 Topic modeling
Topic models and LDA
3. Proposed Methodology
3.1 Tweet collection
Twitter provides access to its documents (tweets) by means of the Twitter API [39].
3.2 Preprocessing
3.3 SLDA
3.4 Evaluation Types
Result
A distributed geo-aware streaming latent Dirichlet allocation model was devel- oped for the purpose of recognizing topics’ locations in unstructured text. To evaluate the model it has been implemented and used for automatic discovery and geographical tracking of election topics during parts of the 2016 American presidential primary elections. It was shown that the locations correlated with the actual election locations, and that the model provides a better geolocation classification compared to using a keyword-based approach.
Sun C Y, Lee A J T. Tour recommendations by mining photo sharing social media[J]. Decision Support Systems, 2017, 101: 28-39.
Motivation
With the increasing popularity of photo and video sharing social networks, more and more people have shared their photos or videos with their family members and friends.
in this paper, we propose a framework for recommending top-k tours tomeet user’s interest and time frame by usinguser-generated contents in a photo sharing social network.
proposed framework
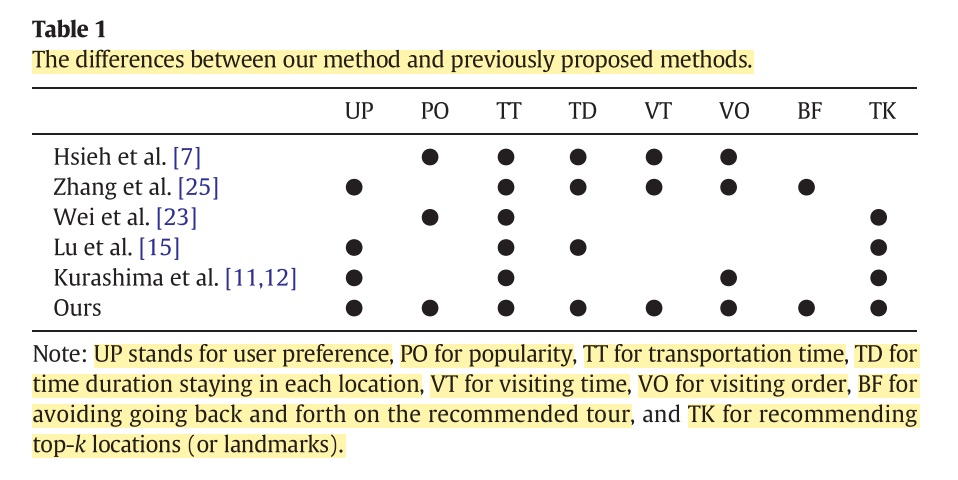
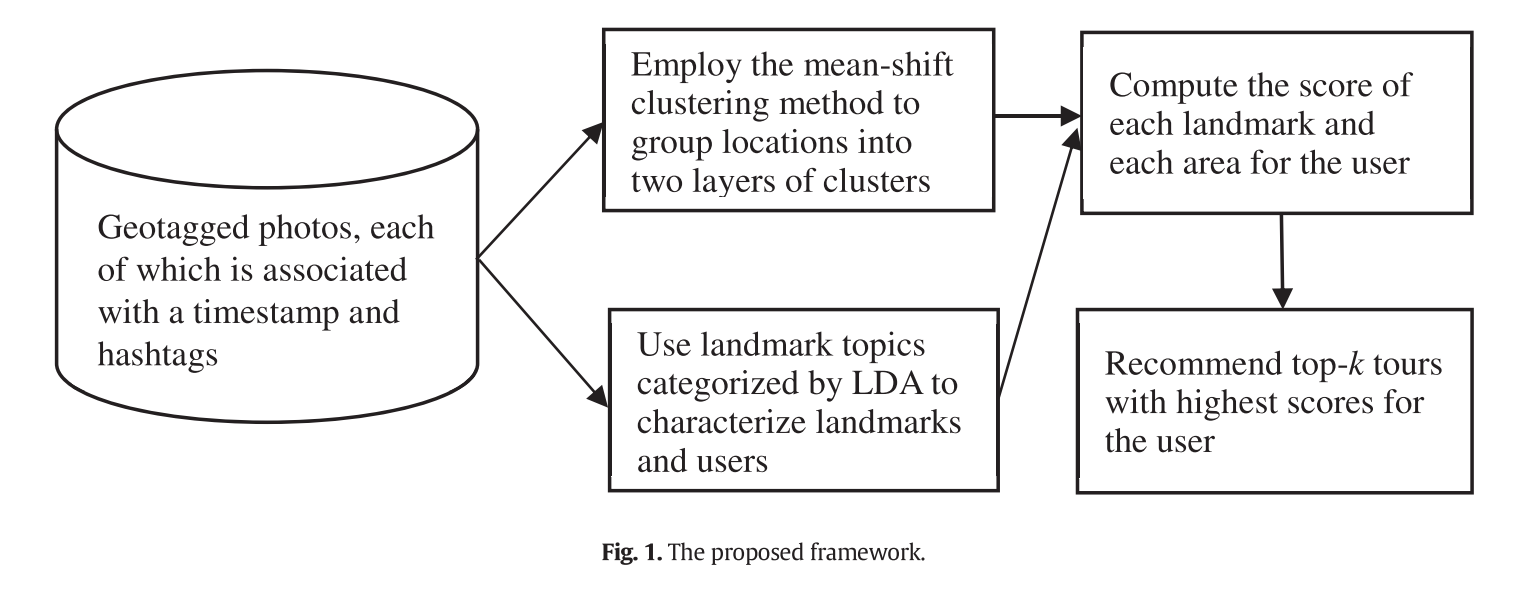
Contribution
The contributions of the proposed framework are summarized as follows.
First, unlikemost previous methods recommending tours landmark by landmark, our framework recommends tours area by area so that users can avoid going back and forth from one area to another and save plenty of time on transportation, which in turn can visit more landmarks.
Second, we category the hashtags posted by users into landmark topics, and then use these topics to characterize landmarks and users.
Third, we develop a method to recommend top-k tours with highest scores for users by further considering visiting time and visiting order of areas. Thus, the recommended tours can meet user’s interest and time frame.
Fourth, the experiment results show that our proposed method outperforms the comparing method.
Finally, our proposed framework may help users plan their trips and customize a trip for each user.
Zhang L, Hu T, Min Y, et al. A taxi order dispatch model based on combinatorial optimization[C]//Proceedings of the 23rd ACM SIGKDD International Conference on Knowledge Discovery and Data Mining. ACM, 2017: 2151-2159.
Motivation
Dispatch
The key component of a taxi-booking app is the dispatch system which aims to provide optimal matches between drivers and riders. Traditional dispatch systems sequentially dispatch taxis to riders and aim to maximize the driver acceptance rate for each individual order. However, the traditional systems may lead to a low global success rate, which degrades the rider experience when using the app.
Destination prediction
Even for the same person, the destinations may be different at different departure times and locations. However, it brings extra work for the users to enter the full name of the destination. Therefore, the user experience can be greatly enhanced if the intended destination can be accurately predicted when a user opens the APP.
Changes
These APPs collect a large amount of individual trajectories on a daily basis. The collected data pro- vide us an unprecedented opportunity to automatically discover knowledge on user behavior, which can be used to build real time intelligent decision making systems in different applications, such as passenger finding [7, 12, 13, 24], taxi demand predicting [16, 17], route planning [14, 22] and taxi order dispatching [8, 11].
Research Gap
Dispatch
A drawback of the methods mentioned above is the long dispatch time and low success rate, because the methods do not optimize the total success rate.
Destination prediction
However, the model does not rely much on problem specific information that can be derived from the data. It heavily depends on the initial continuous trajectory data of the itinerary. Once this part of the data is discarded, the prediction accuracy is greatly reduced
Previous approaches are not applicable for the destination prediction problem at Didi Chuxing, because the prediction is required as soon as a passenger opens the APP, but the trajectory data of the current trip cannot be obtained immediately. Moreover, unlike most previous methods that try to minimize the distance between the predicted destination and the actual destination, we aim to identity the exact destination that the user wants to go. In fact, even if the predicted destination is an alias of the true destination, it is highly likely that the passenger will regard it as an unfamiliar location, and simply inputs the address manually. Therefore, our system takes the set of each user’s historical travel destinations as the candidate set for destination prediction. Personal historical trip statistics is very different among different people. Take year 2015 as an example, the annual taxi booking usage per user is about twenty for users who have used Didi Chuxing at least once. However, it is unevenly distributed as high-frequency users opened the APP daily while low-frequency users opened the APP less than ten times in one year. It is a major challenge to derive accurate personal statistics from such sparse data.
2. ORDER DISPATCH SYSTEM
whether it is accepted by one of the drivers is directly related to each driver’s probability of acceptance. Thus, the key problem for order dispatching is to estimate the probability of each driver’s acceptance of an order.
Therefore, we divide the order dispatch model into two sub-models. One model predicts each driver’s action, in which we estimate the probability of a driver accepting an order. Another model formulates an optimization problem for maximizing the target ESR using the estimated acceptance probabilities, and then solves the underlying optimization problem.
2.1. The model of Driver’s Action Prediction
In this work, we tried two popular models: linear logistic regression (LR) [5] and gradient boosted decision tree (GBDT).
Our system uses SGD (Stochastic Gradient Descent) to train the model parameters [2, 25] . The prediction model considers various factors, which can be summarized as follows: • Order-Driver related features: the pick-up distance, the broadcasting counts of the order to the driver, whether the order is in front of or behind the driver’s current driving direction.
• Order related features: the distance and the estimated time arrival (ETA) between the origin and the destination, the destination category (airport, hospital, school, business district, etc.), traffic situation in the route, historical order frequency at the destination.
• Driver related features: Long-term behaviors (include his- torical acceptance rate of a driver, active locations of a driver, preference of different broadcast distances of a dri- ver, etc.) and short-term interests of a driver such as orders recently accepted or not, etc.
• Supplemental features, such as day of the week, hour of the day, number of drivers and orders nearby.
2.2. The Combinatorial Optimization model
3. DESTINATION PREDICTION
we have discovered some interesting patterns:
(1) The same user tends to go to the same destination at similar times. Specifically, the departure time (time of day) is the most important factor for predicting a user’s intended destination, followed by the departure latitude and longitude. Interestingly, the date variable (workday or holiday) can separate the data into two groups with different characteristics: workday destinations are concentrated on home and workplace; holiday destinations are concentrated on shopping centers, and entertainment places, etc.
(2) The same user tends to go to a fixed set of locations even for shopping in the weekends, except for occasional emergencies such as doctor appointments, business travel, etc.
(3) The order’s location provides useful information for destination prediction. Other information such as the driver information, traffic situation, driving speed, etc. have weak correlations with the destination.
Based on the above observations, we propose to model the probability distribution of a user’s destination using Bayesian rule, in which the user’s historical data such as departure time, departure latitude and longitude are utilized.
4. EXPERIMENT
4.1. Experiments of order dispatch system
4.2 Experiments for destination prediction
Future research
In the future, we will further investigate some interesting problems in the following aspects:
(1) The non-convex problem in the proposed order dispatch model makes it difficult to find a globally optimal solution. We plan to identity a convex surrogate and develop a fast optimization algorithm to solve the corresponding optimization problem.
(2) We will further improve the destination prediction model such that the model is able to discover a new des- tination accurately even if the true destination has never appeared in the user’s historical data.
Gao H, Tang J, Hu X, et al. Content-Aware Point of Interest Recommendation on Location-Based Social Networks[C]//AAAI. 2015: 1721-1727.
Motivation
The rapid urban expansion has greatly extended the physical boundary of users’ living area and developed a large number of POIs (points of interest). POI recommendation is a task that facilitates users’ urban exploration and helps them filter uninteresting POIs for decision making. While existing work of POI recommendation on location-based social networks (LBSNs) discovers the spatial, temporal, and social patterns of user check-in behavior, the use of content information has not been systematically studied. The various types of content information available on LBSNs could be related to different aspects of a user’s check-in action, providing a unique opportunity for POI recommendation.
A Content-Aware POI Recommender System
Result
We model the three types of information under a unified POI recommendation framework with the consideration of their relationship to check-in actions. The experimental results exhibit the significance of content information in explaining user behavior, and demonstrate its power to improve POI recommendation performance on LBSNs.
Contribution
• Study the relationship between users’ check-in behavior and content information on LBSNs in terms of POI properties, user interests, and sentiment indications.
• Incorporate the three types of content information into a unified framework for POI recommendation on LBSNs.
• Investigate the recommendation effort of each type of content information on a real-world LBSN dataset.