2018.11 Paper
Besse P C, Guillouet B, Loubes J M, et al. Destination prediction by trajectory distribution-based model[J]. IEEE Transactions on Intelligent Transportation Systems, 2018, 19(8): 2470-2481.
Motivation
MONITORING and predicting road traffic is of great importance for traffic managers.
It is useful to predict the final destination for several reasons.
Some applications focus on recommending sightseeing places or targeting advertising based on a destination. These applications and advertising appear on our smartphone. They are not necessarily aware of the final destination of the user if he uses a cab or if he uses a know route previously taken and does not have indicated his final destination on his personal device. The prediction of the final destination is essential for these applications.
Some research are also ongoing to automatically set destination in navigation systems based on our daily ride habits. Finally for cabs, predicting the final destination of a taxi has become an essential task. Cab companies, recently adopt electronic dispatch systems instead of VHF-radio systems. In most cases, taxi drivers operating with an electronic dispatch system do not indicate the final destination of their current ride. Hence, it is extremely difficult for dispatchers to know which taxi to contact. in order to improve the efficiency of electronic taxi dispatching systems it is important to be able to predict the final destination of a taxi while it is in service. Particularly during periods of high demand, there is often a taxi whose current ride will end near or exactly at a requested pick up location from a new rider. If a dispatcher knows approximately where their taxi drivers will be ending their current rides, they would be able to best identify which taxi to assign to each pickup request. This problem has been the subject of a Kaggle challenge entitled “ECML/PKDD 15: Taxi Trajectory Prediction (I)”
Proposed framework
In this paper, we propose a new method to predict the final destination of vehicle trips based on their initial partial trajectories.
We first review how we obtained clustering of trajectories that describes user behavior.
Then, we explain how we model main traffic flow patterns by a mixture of 2-D Gaussian distributions. This yielded a density-based clustering of locations, which produces a data driven grid of similar points within each pattern.
We present how this model can be used to predict the final destination of a new trajectory based on their first locations using a two-step procedure:
we first assign the new trajectory to the clusters it most likely belongs.
Second, we use characteristics from trajectories inside these clusters to predict the final destination.
Finally, we present experimental results of our methods for classification of trajectories and final destination prediction on data sets of timestamped GPS-Location of taxi trips.
Lingyu Zhang1, Wei Ai2,∗, Chuan Yuan3,∗, Yuhui Zhang4,∗, Jieping Ye1. 2018. Taxi or Hitchhiking: Predicting Passenger’s Preferred Service on Ride Sharing Platforms. In SIGIR ’18: The 41st International ACM SIGIR Conference on Research & Development in Information Retrieval, July 8– 12, 2018, Ann Arbor, MI, USA. ACM, New York, NY, USA, 4 pages. https: //doi.org/10.1145/3209978.3210153
Motivation
Ride sharing apps like Uber and Didi Chuxing have played an important role in addressing the users’ transportation needs, which come not only in huge volumes, but also in great variety. While some users prefer low-cost services such as carpooling or hitchhik- ing, others prefer more pricey options like taxi or premier services. Further analyses suggest that such preference may also be associ- ated with different time and location.
Research gap
Our work is related to prediction and recommendation problems in transportation systems, especially in modeling the travel need of the passengers. Yet existing works focus more on the destination prediction [5, 8] and demand prediction [4]. The most relevant work is [8], which focuses on the prediction of the destination based on spatio-temporal contexts.
Background
Our analysis is conducted in Didi Chuxing 3, which provides world-leading ride sharing services. The most popular four are:
- Express Express service offers the affordable mobility service where passengers can request for individual or pooled rides. Express made up more than 70% of the trips on RidsS.
- Premier Premier service offers high-end mobility experience with luxury vehicles and drivers trained with highest service standards.
- Taxi Taxi service works with city-registered taxis and sends passengers’ pickup requests to nearby taxis.
- Hitch Hitch provides a social carpooling platform that helps commuters find/provide carpool service to save the cost.
Proposed Method
In this paper, we model users’ choice of services, and build classifiers to predict the user’s choice when opening the app. Intuitively, such choices are correlated with several features: (a) the services that the users have chosen in previous trips, and (b) the current time and location of the users.
Majority: Since Express service is the most affordable and accessi- ble among the four services, by majority guessing, we would predict Express for all trips. This trivial baseline would result in an accuracy of 0.72 and an F1-score of 0.21.
Local Majority: Although in the city level, the Express service is the most popular choice, the case can be different in different local areas. For example, in a high-end residential community or the CBD, most users would prefer the Premier service. Therefore, we implement a basic grid structure by partitioning the map in to 1 km2 square cells and calculate the most popular service in each cell to make prediction. We would then predict the local majority service to all trips within the same sell. This results in an accuracy of 0.74 and an F1-score of 0.31.
Individual Majority:
4.1 Sequential Models
Last Used: The first model assumes that users will choose the same service as their last trip.
4.2 Spatio-Temporal Model
Spatial Model: Although the grid structure greatly reduces the entropy in the training set, creating a “Cell Majority” model for each user would not generalize well in the testing period due to data sparsity. Here, we adopt the decision tree classifier and build a decision tree for each user to model the user-specific relationship between location and service. The model is trained with CART with all default parameters.
Temporal Model: Unlike spatial features where the location of a POI is typically fixed, the temporal distribution of the requests suffers less from sparsity. Therefore, we adopt a Gaussian Mixture Model approach. Exploratory analysis suggests that k = 2 com- ponents are enough to capture most of the trips of a service used by a user. Note that for the time of the day, 23:59 is very close to 00:01, such variables are called circular quantities [3]. We adapt the approach reported in [8] to calculate the mean and variance of the distribution, and we modify the traditional GMM accordingly to account for the circular quantities.
4.3 Ensemble Model
So far, we have introduced several different models, each of which utilizes a particular feature: The Markov model utilizes the sequen- tial feature, the Spatial model utilizes the spatial feature, and the Temporal utilizes the temporal features. These models allow us to measure how much improvement each feature brings, however different users may benefit from different models since their pref- erence may be more correlated with some features than others. It is desirable to have one unified model that combine all features.
Ensemble: The three models, namely Markov, Spatial, and Tem- poral vote on their best guesses with equal weight and the service with the most vote is the final prediction. In case of tie (all three models predicts differently), the prediction from Spatial model is chosen.
Evaluation
Since the prediction task is a classic multi-class classification prob- lem, we would use accuracy as the evaluation metric. However, since more than 70% trips are made with Express, the classification task suffers from imbalanced data. Therefore, we will also report the macro-F1 score, in order to make sure the classifier is fair to all services. This is crucial in assuring the product team to adopt our model without harming any particular line-of-business.
Future Research
Adding More Features: Our model can greatly benefit from in- cluding more features. For example, the type of the origin POI (business, residential, shopping, etc.) would allow us to better understand the purpose of the trip, which translates into the preferred line-of-business.
Counting for the Supply: So far, our analysis focuses only on the demand (passenger) side of the ride sharing. Yet the supply (driver/vehicle) side can also affect users’ choice. For example, many drivers only work as Express drivers during the weekend. Thus, an experienced user knowing such supply pattern would avoid requesting Express on weekdays.
Controlling Other Contexts: Other contexts may potentially affect the user’s choice. For example, the coupons and promotions provide provide strong incentives for the users to choose a certain service. For another example, the “default” option offered by the system could also affect the user’s preference without the user knowing it. The current app interface implements a Last Used model as the default choice. Could that be the reason why the Last Used works well for inactive users? We plan to explore these in our future work.
Moreira-Matias L, Gama J, Ferreira M, et al. Predicting taxi–passenger demand using streaming data[J]. IEEE Transactions on Intelligent Transportation Systems, 2013, 14(3): 1393-1402.
Motivation
Informed driving is increasingly becoming a key feature for increasing the sustainability of taxi companies. The sensors that are installed in each vehicle are providing new opportunities for automatically discovering knowledge, which, in return, delivers information for real-time decision making. Intelligent transportation systems for taxi dispatching and for finding time-saving routes are already exploring these sensing data.
A failure in this equilibrium may lead to one of the following two scenarios: Scenario 1, i.e., an excess in vacant vehicles and competition and Scenario 2, i.e., larger waiting times for passengers and lower taxi reliability. However, a question remains open. Is it possible to guarantee that the taxis’ spatial distribution over time will always meet the demand, even when the number of running taxis already does that?
Changes
ADVANCES in sensor and wireless communications such as Global Positioning System (GPS), Global System for Mobile Communications (GSM), and WiFi have provided a new way of communicating with running vehicles while col- lecting relevant information on their status and location.
Research Gaps
Despite their useful insights, most reported techniques are tested using offline testbeds, discarding some of the main advantages of this type of signal. In other words, they do not provide any live information on the location of a passenger or the best route to pick up a passenger at the current specific date/time (i.e., real-time performance), while the GPS data are mainly a live data stream (i.e., a time-ordered sequence of instances that are produced in real-time [14]).
The stand-choice problem is based on four key variables:
1) the expected revenue for a service over time;
2) the distance/ cost relation with each stand;
3) the number of taxis that are already waiting at each stand;
4) the passenger demand for each stand over time.
The taxi vehicular network can be a ubiquitous sensor of taxi–passenger demand from where the aforementioned variables can be continuously mined. However, the work described here will just focus on the spatiotemporal complexity of the passenger demand.
Proposed Model
This paper presents a model for predicting the number of services that will emerge at a given taxi stand.
Contribution
The major contribution of this paper facing this state of the art is to build predictions on the spatiotemporal distribution of the taxi–passenger demand using streaming data. The existing research presents offline testbeds, whereas the framework that is presented here was tested in an online environment.
Nourinejad M, Zhu S, Bahrami S, et al. Vehicle relocation and staff rebalancing in one-way carsharing systems[J]. Transportation Research Part E: Logistics and Transportation Review, 2015, 81: 98-113.
Motivation
A solution to the imbalance of vehicles in one-way carsharing systems is vehicle relocation which involves staff members to redistribute the vehicles between stations. Vehicle relocation, however, can lead to an imbalance of staff members between stations. Thus, staff members, themselves, need to be relocated between stations to perform the vehicle relocations.
Background
CSOs are generally classified as one-way and round-trip systems. Round-trip systems (e.g. Zipcar and Autoshare) require users to return the rented vehicle to the same station from which it was picked up (Costain et al., 2012). One-way systems (e.g. Car2Go), on the other hand, are flexible about the drop-off station and do not impose any restrictions. According to their definitions, round-trip systems are a special case of one-way systems with drop-off station constraints. This extra constraint can be unappealing to users who have longer activity durations or those who do not need the return trip at all.
One-way CSOs are further divided into free-floating and station-based (non-free-floating) systems.
In free-floating systems, users are allowed to park the vehicles at any location of choice but generally within some predetermined boundary whereas in station-based systems users are obliged to park the vehicles at designated parking stations. Despite their many benefits, one-way systems pose some challenges. As users freely move vehicles between stations, an imbalance of vehicles can occur.
To relieve vehicle imbalance, one-way CSOs relocate vehicles between stations (Kek et al., 2009; Nourinejad and Roorda, 2014), impose parking reservation policies (Kaspi et al., 2014), and balance their station capacities (El Fassi et al., 2012). Among these, vehicle rebalancing is imperative as it entails a trade off between fleet size and staff size. Roughly speak- ing, CSOs with relatively large fleet sizes require few relocation operations and consequently few relocating staff whereas CSOs with smaller fleet sizes require more extensive relocation operations and consequently more staff members to perform them. Alternatively, as the staff are relocating vehicles, an imbalance of staff can also occur.
Research question
Hence, three sets of problems are at hand:
(i) given a database of user reservations, which we assume to be given, what is the required fleet and staff size in order to serve all users with the objective of cost minimization,
(ii) how should the vehicles be relocated in the network,
(iii) how should staff be assigned to different vehicle relocation tasks.
In answering the three proposed questions, this study presents a joint optimization model of vehicle relocation and staff rebalancing. While vehicle relocation has been studied before, staff rebalancing requires further research. Most available models assume that a vehicle can be relocated from any station to any other station regardless of whether a staff member is present to perform the relocation task or not. This oversight of staff members weakens applicability of any model.
Vehicle relocation
In a comprehensive literature review on carsharing systems
Jorge and Correia (2013) identify vehicle relocation as one of the fundamental strategies for reducing costs in one-way systems.
Among the first to consider vehicle relocation are Dror et al. (1998) who propose using a fleet of finite capacity tow trucks to redistribute a fleet of electric vehicles. This problem is modeled as a pickup and delivery problem and a mixed integer linear programming formulation is provided.
Barth and Todd (1999) develop a simulation model with three main components: (i) a stochastic trip generator which produces origin–destination pairs and inter-request times (i.e. time between two requests), (ii) a traffic simulator which takes trip generation inputs and simulates each vehicle in the network according to trip features such as departure time and origin–destination zones, and (iii) a relocation mechanism which can be static, predictive, or exact. Static relocation is based on the immediate relocation need at a station where a request has occurred but no vehicle is available, predictive relocation uses knowledge of expected vehicle demand in the future, and exact relocation assumes that perfect knowledge of future demand is available. Their study shows that vehicle relocation is minimized when there are 18–24 vehicles available for every 100 users. However, it is not clear whether an optimization approach would provide lower operating costs.
In another simulation-based research, Wang et al. (2010) present a forecast-based relocation model with the following three major components: (i) macroscopic traffic simulation, (ii) forecasting model, and (iii) inventory replenishing model. In the forecasting model an estimate of aggregate origin–destination demand is obtained which is passed on to the inventory replenishing model where relocations are composed. In the inventory replenishment model, stations holding excessive or too few vehicles are labeled overstocked and understocked, respectively. The relocation process involves moving vehicles from overstocked stations to understocked stations. The performance of the model is tested on a real-life case study of a CSO in Singapore with four stations and twelve vehicles per station. While the model shows an improvement in the system’s efficiency, it is questionable whether any improvement would occur in larger CSOs. Moreover, it is possible that a rigorous optimization method would provide even better results.
In pursuing lower costs through optimization
Kek et al. (2009) propose a three phase optimization-trend-simulation decision support system to find a set of near-optimal parameters for vehicle relocation operations in a CSO with flexible return times and return stations. The optimization-trend-simulation method first solves a Mixed Integer Linear Program (MILP) to minimize total operating costs and second uses a heuristic to convert the MILP results into more practical operating parameters such as selection of two relocation thresholds. That is, when the number of vehicles at a station goes below (first threshold) or above (second threshold) some value, then relocation is initiated. The results of optimization-trend-simulation method, compared to current practice, show an improvement of 50% in staff costs and an improvement in zero vehicle time (total duration of vehicle shortage at all station) of 4.6% up to 13.0%.
Moving up to a higher level of decision making, Correia and Antunes (2012) present an MILP formulation to optimize depot location in a one-way carsharing system while maximizing CSO benefits. Given the strategic level of decision-making, the authors use aggregate inputs such as total origin–destination demand at each time segment and model a time–space network to formulate the problem. Chow and Sayarshad (2014) study the benefit of sharing system in coexistence with other networks such as public transportation. Boyaci et al. (2015) present a model for developing efficient one-way CSOs with an electric fleet. Their proposed model is a multi-objective MILP which considers vehicle relocation and vehicle charging requirements.
Nourinejad and Roorda (2014) define a finer level of demand by considering each user individually and taking into account their request time (time at which service was requested), departure time (from the origin), and arrival time (at the destina- tion). Their model can be used as both a decision support system to find optimal relocation operations and as a strategic decision-making tool in finding optimal fleet size when the problem is solved many times for numerous user service request patterns.
Jorge et al. (2013) propose a mathematical programming and a simulation model for vehicle relocation in one-way carsharing systems. The mathematical model maximizes the profitability of the CSO whereas the simulation model applies different real-time relocation policies. This model is applied to a network of CSO stations in Lisbon, Portugal and the results show increased profits through vehicle relocation.
Cepolina and Farina (2012) present a model for managing eco-sustainable carsharing vehicles in urban areas. They study three systems ofopen access, open-ended reservation, and one way trip reser- vation and develop an optimization problem to minimize the total transport and users costs associated with each system.
Nourinejad and Roorda (2015) analyze the carsharing vehicle relocation problem for one-way and two-way systems. They conclude that a higher fleet size is required in round-trip systems due to the requirement of returning vehicles to their original pickup locations.
The focus of some studies is on system optimization under sources of uncertainty
Fan et al. (2008) present a multistage stochastic mixed integer model with uncertainties in demand variation. The model has the objective of maximizing revenues and minimizing relocation costs.
Nair and Miller-Hooks (2011) present a stochastic mixed-integer model to minimize the cost of vehicle relocation under demand uncertainty. By considering probabilistic demand, the model finds optimal relocation operations in a fixed short planning horizon. Relocation in the model is generally triggered when there is a vehicle short- age at a station which would sacrifice demand or if a station has a shortage of parking stalls which would lead to excess user waiting time because users would not have a spot to park the vehicles.
Alfian et al. (2014) develop a simulation tool based on fuzzy classification aimed at evaluating the performance of 36 different service models with different relocation techniques to find the most profitable while satisfying a minimum required customer level-of-service (measured in terms of reservation acceptance ratio).
Others have devised novel solutions to the vehicle imbalance problem
Correia et al. (2014) present a mathematical programming model that gives users the flexibility to choose from several stations to pick up a vehicle. Moreover, the users can drop off their vehicle to any station within the vicinity of their destination. Compensation is offered to users for this imposed inconvenience. This flexibility allows for better balancing of vehicles between stations.
Similar pricing mechanisms have been proposed by Di Febbraro et al. (2012) and Waserhole et al. (2013).
Another strategy presented by Kaspi et al. (2014) allows users to reserve a parking stall at the destination in advance. This strategy, applicable in cases where stations have limited parking stalls, eliminates the possibility of a customer having to wait at a station until an empty parking stall becomes available.
The vehicle relocation problem in carsharing systems has some similarities with the bike relocation in bike sharing systems
These relocations can be static or dynamic. Static relocation generally occurs once and during off-peak hours when demand is low whereas dynamic relocation happens multiple times during the day with varying demand for bikes. On static relocation,
Chemla et al. (2013) present a many to many pickup and delivery problem where a capacitated single vehicle relocates the bikes between stations in order to reach a target number of vehicles at each station. A branch-and-cut algo- rithm is used to solve a relaxation of the problem.
Dell’Amico et al. (2014) study four different variants of the same pickup and delivery problem for bike relocation and propose branch-and-cut algorithms to solve each.
Forma et al. (2015) propose a three-step heuristic for repositioning of bikes. In the first step, clusters of bike stations are formed; in the second step, inventory decisions are made for each station of each cluster; and in the third step, repositioning vehicles are routed between stations of each cluster.
On dynamic relocation, Contardo et al. (2012) and Sayarshad et al. (2012) present two models which take into account the variation of demand throughout the day.
At a higher level of decision-making, Raviv and Kolka (2013) and Schuijbroek et al. (2013) use inventory target levels to compute the optimal number of bikes at each station. The results of these studies can eventually be used as input for finding the optimal pick and delivery routes for bike relocation. These models are similar to the study of George and Cathy (2011) who propose a closed queuing network model for finding the optimal fleet size at a vehicle rental system. The carsharing industry also has some similarities with the car rental industry. You and Hsieh (2014) present a vehicle relocation model for car rental services with a fixed fleet size and varying demand for a specific number of days. The relocations are performed at the end of each day and the fleet size is assumed to be constant. The authors use a mathematical programming model combined with a genetic algorithm to solve the problem.
In addition to bikesharing, the carsharing vehicle relocation problem has distinct similarities with the full truckload pickup and delivery problem (Berbeglia et al., 2010)
The two most commonly used methods of solving the full truckload problem are the network flow maximization and the assignment method. The network flow model, which is sometimes pre- sented as a timespace network, involves optimizing the flow of vehicles (or trucks) to service all or the most profitable requests. In the carsharing context, Kek et al. (2009) and Boyaci et al. (2015) use a similar network flow approach. The assignment model, on the other hand, involves assigning individual vehicles to requests (also known as jobs) with time windows during which a pickup must take place (Wang and Regan, 2002). The presented carsharing model of this paper uses the same assignment approach where users have time windows and vehicles have to be assigned to them.
Results
This study addresses the joint optimization of vehicle relocation and staff rebalancing using two integrated multi-traveling salesman formulations. Results show that fleet size is more sensitive to demand than staff size, staff size is inversely related to vehicle cost, and that vehicle relocation time increases with vehicle cost.
Bulhões T, Subramanian A, Erdoğan G, et al. The static bike relocation problem with multiple vehicles and visits[J]. European Journal of Operational Research, 2018, 264(2): 508-523.
Research goal
This paper introduces the static bike relocation problem with multiple vehicles and visits , the objective of which is to rebalance at minimum cost the stations of a bike sharing system using a fleet of vehicles.
There exists a rich body of research on the problem of rebalancing BSSs, mainly for two variants of the problem: the static version and the dynamic version. The main difference between the two variants is the customer demand during the rebalancing operation, which is assumed to be zero for the static variant while it can be non-zero for the dynamic variant.
Review
The studies on the static version can be traced back to the seminal paper of Benchimol et al. (2011) in which the authors intro- duced the static stations balancing problem (SSBP) and proved it to be NP-Hard.
Proposed Method
we include the handling times of the bikes within the service time limit of the ve- hicles to ensure that the workload constraint is not violated. This problem is called the static bicycle relocation problem with multiple vehicles and visits (SBRP-MVV)z
In this paper, we study the SBRP-MVV, which is a realistic representation of the real-world problem. The necessity of multiple visits arises from the existence of large, central bike stations the demand of which cannot be satisfied in a single visit. We present an iterated local search heuristic for the SBRP-MVV that benefits from subsequence based data structures, allowing the algorithm to perform move evaluations in amortized constant time. We also develop and present an integer linear programming formulation and an associated branch-and-cut algorithm for the SBRP-MVV.
Yazici, M. Anil, Camille Kamga, and Abhishek Singhal. “A big data driven model for taxi drivers’ airport pick-up decisions in new york city.” 2013 IEEE International Conference on Big Data. IEEE, 2013.
Motivation
Taxis play a vital role in airport ground transportation in terms of local and regional accessibility to and from the city. Taxi drivers’ decisions to make airport trips are one of the most important factors that maintain taxi demand and supply equilibrium at the airports.
Research goal
The aim of this paper is to model the taxi drivers’ airport pick-up decision for JFK airport using a comprehensive taxi trip data to identify the airport trips in the city. The decision model is used to suggest policies to overcome the taxi shortage within the existing regulations.
TAXI DRIVERS’ AIRPORT PICK-UP DECISION MODEL
A. Time of Day, Day of Week, Weather Conditions Taxi
B. Expected Net Gain
C. Location
D. First Trip
E. Short Return Ticket
Moreira-Matias L, Gama J, Ferreira M, et al. Predicting taxi–passenger demand using streaming data[J]. IEEE Transactions on Intelligent Transportation Systems, 2013, 14(3): 1393-1402.
Motivation
Informed driving is increasingly becoming a key feature for increasing the sustainability of taxi companies. The sensors that are installed in each vehicle are providing new opportunities for automatically discovering knowledge, which, in return, delivers information for real-time decision making. Intelligent transportation systems for taxi dispatching and for finding time-saving routes are already exploring these sensing data.
Research question
A failure in this equilibrium may lead to one of the following two scenarios: Scenario 1, i.e., an excess in vacant vehicles and competition and Scenario 2, i.e., larger waiting times for passengers and lower taxi reliability.
However, a question remains open. Is it possible to guarantee that the taxis’ spatial distribution over time will always meet the demand, even when the number of running taxis already does that?
there is no economic viability of adopting random cruising strategies to find passengers
This paper focuses on the real-time choice problem of which is the best taxi stand to go to after a passenger drop-off (i.e., the stand where another passenger can be picked up more quickly).
The stand-choice problem is based on four key variables:
1) the expected revenue for a service over time;
2) the distance/ cost relation with each stand;
3) the number of taxis that are already waiting at each stand;
4) the passenger demand for each stand over time.
However, the work described here will just focus on the spatiotemporal complexity of the passenger demand.
LITERATURE REVIEW
Trains [20], buses [21], [22], and taxi networks [17] are already success- fully exploring these traces.
Gonzalez et al. [23] uncovered the spatiotemporal regularity of human mobility, which was demonstrated in other activities such as electricity load [24] or freeway traffic flow [15], [25], [26].
multiple researchers have used GPS historical data to analyze the spatial structure of passenger demand. Deng and Ji [8] mined this type of data to build and explore an origin–destination matrix in the city of Shanghai, China. Liu et al. [9] used a 3-D clustering technique to analyze the spatial patterns of mobility intelligence for both top and ordinary drivers. Yue et al. [10] discovered the level of attractiveness of urban spatiotemporal clusters.
Research works that are focused on passenger/taxi-finding strategies commonly use data from Scenario-2 cities, where the demand largely exceeds the supply. An innovative study was presented by Li et al. [11]. Their goal was to validate the triplet time–location–strategy as the key features to build a good passenger-finding strategy. They used an L1-norm support vector machine as a feature selection tool to discover both efficient and inefficient passenger-finding strategies in a large city in China. They conducted an empirical study on the impact of the selected features, and their conclusions were validated by the feature selection tool. Lee et al. [12] created a framework to describe the spatiotemporal structure of the passenger demand on Jeju Island, South Korea. A customer-focused approach was developed by Phithakkitnukoon et al. [13], i.e., to predict where and when the vacant taxis will be to aid the clients in their daily scheduling and planning.
Ge et al. [27] provided a cost-efficient route recommendation model, which was able to recommend sequences of pick-up locations. Their goal was to learn from the data that are transmitted from the most successful drivers to improve the profit of the remaining ones. Yuan et al. presented in [28] a complete work containing methods about the following: 1) how to divide the urban area into pick-up zones using spatial clustering; 2) how a passenger can find a taxi; and 3) which trajectory is the best to pick up the next passenger. Although their results are promising, both approaches are focused on improving the trajectory of a single driver, disregarding the position of the remaining drivers.
Little research regarding the demand prediction problem exists. Kaltenbrunner et al. [18] detected the geographic and temporal mobility patterns over data that are acquired from a bicycle network running in Barcelona. This paper also ad- dresses the prediction problem using an autoregressive moving average (ARMA) model. The authors’ goal was to forecast the number of bicycles at a station to improve the stations’ spatial deployment. Chang et al. [19] presented a novel insight on demand prediction; the authors applied clustering to the data that are extracted from large Asian cities, using other key fea- tures aside from location/time such as the weather. Their output was a hotness probability ratio over spatial clusters (i.e., real agglomeration of roads/streets) depending on the driver’s loca- tion. However, the authors disregard the position of other taxis.
ARIMA models are time-series forecasting models that are widely known for their short-term prediction performance [17]– [19], [26], [29]–[31]. The short-term prediction of traffic flow is addressed by Min and Wynter [26]. The authors use both historical data and spatial correlations between road segments to forecast the speed and the volume of traffic in a road network. Although their contribution is useful, the spatial correlations are difficult to maintain/update in a real-time testbed (their testbed was performed offline). The most similar work to our own is presented by Li et al. [17]. The authors present a recommendation system for improving the drivers’ mobility intelligence. To do so, data from a taxi network running in Hangzhou, China (Scenario 2), was used. First, they calcu- lated the city hotspots, i.e., urban areas where pick-ups more frequently occur. Second, they used ARIMA to forecast the amount of pick-ups at these hotspots over periods of 60 min. Third, they presented an improved ARIMA depending both on time and day type. Finally, they proposed a recommendation system based on the following variables: 1) the number of taxis that are already located at each hotspot; 2) the distance from the driver’ location to the hotspot in terms of time; and 3) the prediction of the number of services to be demanded in each one of them. Despite their good results, this approach comparatively has the following three weak points to the one presented: 1) it just uses the most immediate historical data, discarding the mid- and long-term memory of the system; 2) in their testbed, the authors use minimum aggregation periods of 60 min over offline historical data (i.e., the next value prediction task on a time series is easier as long as the aggregation period is increased), whereas we use short-term periods of 30 min; and 3) the work does not clearly describe how the authors update both the ARIMA model and the weights that are used by it.
Proposed method
This paper presents a model for predicting the number of services that will emerge at a given taxi stand
This paper introduces a novel methodology for predicting the spatial distribution of taxi–passengers for a short-term time horizon using streaming data.
First, the information was aggregated into a histogram time series.
Then, three time-series forecasting techniques were combined to originate a prediction. Experimental tests were conducted using the online data that are transmitted by 441 vehicles of a fleet running in the city of Porto, Portugal.
The results demonstrated that the proposed framework can provide effective insight into the spatiotemporal distribution of taxi–passenger demand for a 30-min horizon.
Time-Varying Poisson Model
Consider the probability for n taxi assignments to emerge in a certain time period P(n), following a Poisson distribution.
Weighted Time-Varying Poisson Model
it is not guaranteed that every taxi stand will have a highly regular passenger demand; in fact, the demand in many stands can be often seasonal.
ARIMA Model
The two previous models assume the existence of a regular (seasonal or not) periodicity in taxi service passenger demand (i.e., the demand at one taxi stand on a regular Tuesday during a certain period will be highly similar to the demand verified during the same period on other Tuesdays). However, the demand can present distinct periodicities for different stands. The ubiquitous features of this network force us to rapidly decide if and how the model is evolving so that it is possible to instantly adapt to these changes.
The ARIMA [16] is a well-known methodology for both modeling and forecasting univariate time-series data such as traffic-flow data [26], electricity price [29], and other short- term prediction problems such as the one presented here. There are two main advantages to using ARIMA compared with other algorithms. First, it is versatile to represent very different types of time series, i.e., the autoregressive (AR) ones, the moving average (MA) ones, and a combination of those two (ARMA). Second, it combines the most recent samples from the series to produce a forecast and to update itself to changes in the model.
Sliding-Window Ensemble Framework
Three distinct predictive models have been proposed, which focus on learning from the long-, mid-, and short-term his- torical data. However, a question remains open. Is it possible to combine them all to improve our prediction? Over the last decade, regression and classification tasks on streams attracted community attention due to their drifting characteristics. The ensembles of such models were specifically addressed due to the challenge that is related to this type of data. One of the most popular models is the weighted ensemble [34]. The model proposed next is based on this one.
Data
The data were continuously acquired using the telematics installed in each one of the 441 running vehicles of the company fleet. This taxi central usually runs in one out of three 8-h shifts, i.e., from midnight to 8 AM,from8 AM to 4 PM, and from 4 PM to midnight.
Each data chunk arrives with the following six attributes:
1) TYPE, which is relative to the type of event reported (it has four possible values: busy, i.e., the driver picked up a passenger; assign, i.e., the dispatch central assigned a previously required service; free, i.e., the driver dropped off a passenger; and park, i.e., the driver parked at a taxi stand);
2) STOP, which is an integer with the ID of the related taxi stand;
3) TIMESTAMP, which is the date/time in seconds of the event;
4) TAXI, which is the driver code;
5) LATITUDE
6) LONGITUDE, corresponding to the acquired GPS position.
Contribution
The major contribution of this paper facing this state of the art is to build predictions on the spatiotemporal distribution of the taxi–passenger demand using streaming data. The existing research presents off line testbeds, whereas the framework that is presented here was tested in an online environment.
1) It mines both the periodicity and the seasonality of the passenger demand, regularly updating itself.
2) It simultaneously uses long-, mid-, and short-term histor- ical data as a learning base.
3) It takes advantage of the ubiquitous characteristics of a taxi network, assembling the experience and the knowl- edge of all vehicles/drivers, which they usually just do on their own.
Tong Y, Chen Y, Zhou Z, et al. The simpler the better: a unified approach to predicting original taxi demands based on large-scale online platforms[C]//Proceedings of the 23rd ACM SIGKDD International Conference on Knowledge Discovery and Data Mining. ACM, 2017: 1653-1662.
Motivation
Taxi-calling apps are gaining increasing popularity for their efficiency in dispatching idle taxis to passengers in need. To precisely balance the supply and the demand of taxis, online taxicab platforms need to predict the Unit Original Taxi Demand (UOTD), which refers to the number of taxi-calling requirements submitted per unit time (e.g., every hour) and per unit region (e.g., each POI). Predicting UOTD is non-trivial for large-scale industrial online taxicab platforms because both accuracy and flexibility are essential.
Complex non-linear models such as GBRT and deep learning are generally accurate, yet require labor-intensive model redesign after scenario changes (e.g., extra constraints due to new regulations).
Information of UOTD benefits online taxicab platforms in triple ways.
(i) Expanding potential market. By comparing historical UOTD with the corresponding number of PU, the platforms can discover times and regions with strong taxi-calling motivation yet few final taxi rides.
(ii) Assessing incentive mechanisms. UOTD reflects the willingness of users to travel by taxi after adopting new discount strategies and dynamic pricing.
(iii) Guiding taxi dispatching. Predicting UOTD facilitates online taxicab platforms to allocate roaming taxis to passengers in advance. Hence predicting UOTD is a foundational issue in large-scale online taxicab industries.
Review
Despite extensive research efforts on taxi demand prediction [14, 15, 28], none of them are applicable in predicting UOTD. These works focus on predicting the number of PU. They usually predict the number of PU based on the correlation between PU and taxi trajectories. However, taxi trajectories are not always associated with UOTD (e.g., original taxi demands that are cancelled or without successful passenger pick-ups), making it impossible to extend works on PU prediction to UOTD prediction.
Due to their inherent complexity, real-world prediction problems are mainly solved by high VC-dimension models [20], which consists of two paradigms: (i) complicated (non-linear) models with a small number of features [7, 9] and (ii) simple (linear) models with massive sets of features [8, 13].
DATA DESCRIPTION
Original Taxi Demand Record Data
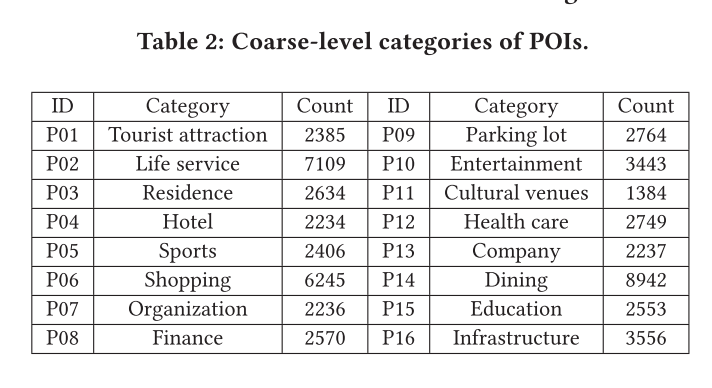
POI Data
The three-level category consists of a coarse-level (Entertainment), a mid-level (Ourdoor Activity) and a sub-level (Playground), respectively.
In total the POIs are divided into 16 coarse-levels, 83 mid-levels, and 155 sub-levels.
Meteorology Data
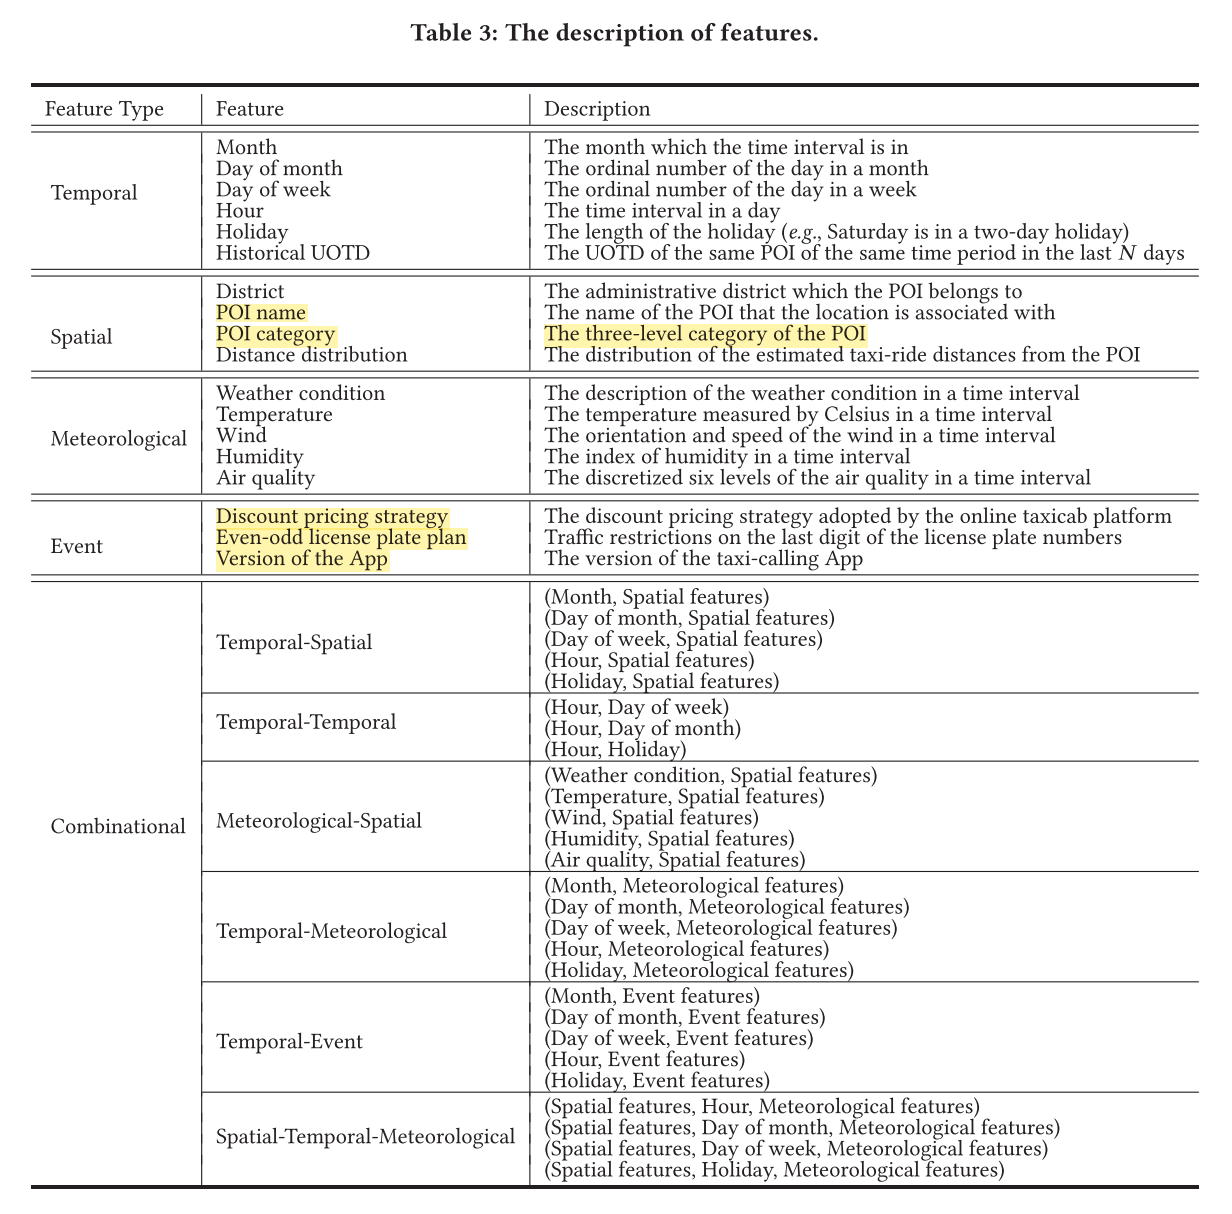
FEATURE ENGINEERING
Proposed method
To mitigate such heavy burden, we propose to transfer model redesign to feature redesign. Specifically, we leverage the latter paradigm, i.e., a linear model with massive features, to ease integration ofnew information with a unified framework.
A natural question arises whether a unified simple linear model is able to predict UOTD accurately. We tackle this problem by integrat- ing high-dimensional features from heterogenous datasets. Specifically, we propose LinUOTD, a unified UOTD prediction framework with a linear model and high-dimensional (200 million) features. Fig. 1 illustrates the overview of LinUOTD. We first investigate multiple real-world datasets including original taxi demands (OTD), points ofinterest (POI) and meteorology. We then extract four types of basic features over space, time, meteorology and event domains, and generate massive combinatorial features based on the business logics of online taxicab platforms.
To accurately predict UOTD while remaining flexible to scenario changes, we propose LinUOTD, a unified linear regression model with more than 200 million dimensions of features. The simple model structure eliminates the need of repeated model redesign, while the high-dimensional features contribute to accurate UOTD prediction. We further design a series of optimization techniques for efficient model training and updating.
UOTD Prediction Model
Result
Evaluations on two largescale datasets from an industrial online taxicab platform verify that LinUOTD outperforms popular non-linear models in accuracy. We envision our experiences to adopt simple linear models with high-dimensional features in UOTD prediction as a pilot study and can shed insights upon other industrial large-scale spatio-temporal prediction problems.
Contribution
To the best of our knowledge, this is the first effort that adopts a simple linear model with very high-dimensional (hundreds of millions) features in predicting UOTD, to meet the requirements of accuracy and flexibility in large-scale online taxi- cab platforms. We transform the overhead of model redesign into feature engineering, and apply a distributed learning framework to support rapid, parallel and scalable feature updating and testing. Surprisingly, evaluations on two real datasets from the largest on-line taxicab platform in China reveal that our approach outperforms classical non-linear models in prediction accuracy. As a pilot study, we envision our successful experiences on adopting simple linear models with high-dimensional features can shed light upon other large-scale industrial spatio-temporal prediction problems.
Mukai N, Yoden N. Taxi demand forecasting based on taxi probe data by neural network[M]//Intelligent Interactive Multimedia: Systems and Services. Springer, Berlin, Heidelberg, 2012: 589-597.
Motivation
The taxi is a flexible transportation system that everyone can move to any destination. However, in Japan, the charge for the taxi is more expensive than other transportation facilities. The taxi business is in a very tough situation because the cost of crude oil suddenly increased in addition to the influence of the over-supply of the taxi market. Recently, the application of Information Technologies has advanced on taxi industries (e.g., the fare payment by non-contact IC and car navigation system). One of the technologies that gain such the attention is a probe system which can store a large amount of customer trajectory data. The probe system will improve the profitability of taxi companies if the demand in the future can be forecasted from the statistics.
One of the technologies for transportation systems in the spotlight is a taxi probe systemwhich provides historical data of taxi (i.e., latitude and longitude when a taxi picks up a customer). Taxi probe data is just beginning to be applied to a variety of uses.
Research question
In this paper, we try to forecast the taxi demands by using the taxi probe data.
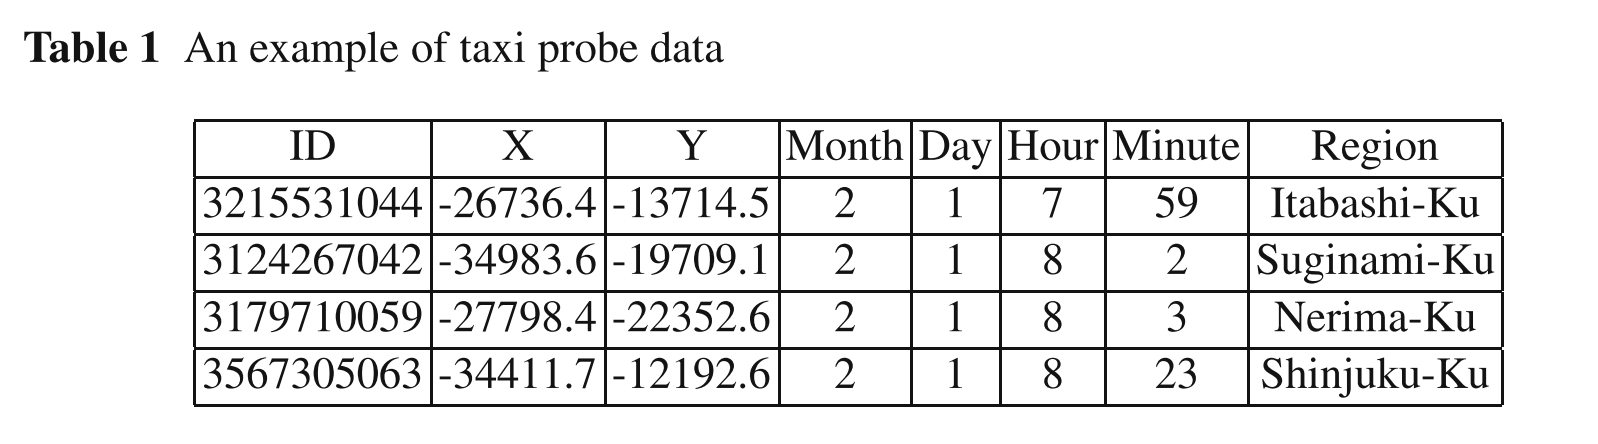
Taxi Probe Data
The taxi probe data we used are offered by Tokyo Musen Taxi 1. The probe data are recorded from February 1st to March 31, 2009, and the travel region of taxis is in Tokyo’s 23 wards, Mitaka-shi, and Musashino-shi.
Demand Forecasting by Neural Network
Training Data Set
We have taxi probe data during two months (i.e., February 1st to March 31, 2009). Thus, the data of first month (i.e., February 1st to 28) are used as training data set, and the data of last month (i.e., March 1st to 31) are used as validation data set.
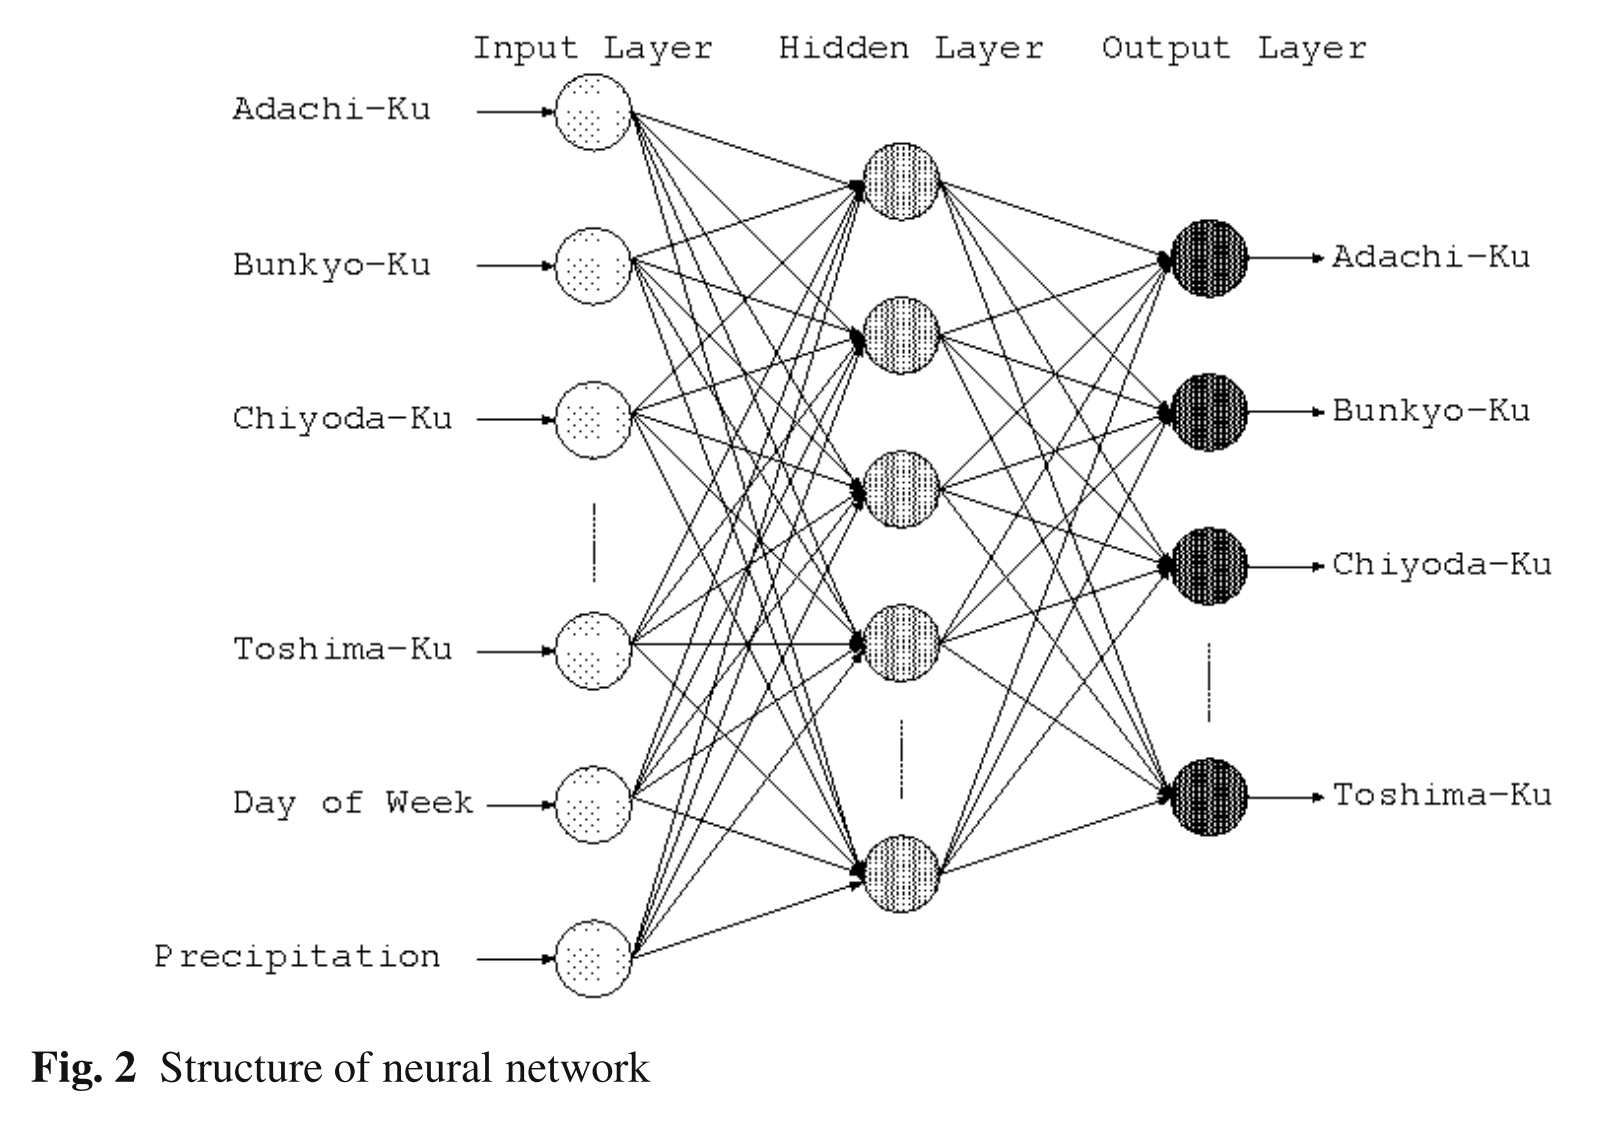
Proposed method
Therefore, in this paper, we try to forecast the taxi demands from the taxi probe data by a neural network (i.e., multilayer perceptron). First, we analyze the statistics of the taxi demands and make the training data set for the neural network. Then, the back-propagation learning is applied to the neural network to reveal the relationship of regions in the Tokyo(i.e., 23-words, Mitaka-shi, and Musashino-shi).
Result
We found that day of the week is important factor for demand forecasting because the demands occur periodically in a week. Furthermore, the demand forecasting in business town like Chuo-Ku is more easy compared to bed town like Edogawa-Ku. However, the amount of precipitation is ineffective because we considered whether the rain falls or not.
Yao H, Wu F, Ke J, et al. Deep multi-view spatial-temporal network for taxi demand prediction[J]. arXiv preprint arXiv:1802.08714, 2018.
Motivation
Taxi demand prediction is an important building block to en- abling intelligent transportation systems in a smart city. An accurate prediction model can help the city pre-allocate re- sources to meet travel demand and to reduce empty taxis on streets which waste energy and worsen the traffic conges- tion. With the increasing popularity of taxi requesting ser- vices such as Uber and Didi Chuxing (in China), we are able to collect large-scale taxi demand data continuously. How to utilize such big data to improve the demand pre- diction is an interesting and critical real-world problem.
Traditional demand prediction methods mostly rely on time series forecasting techniques, which fail to model the complex non-linear spatial and temporal relations. Recent advances in deep learning have shown superior performance on traditionally challenging tasks such as image classification by learning the complex features and correlations from large-scale data. This breakthrough has inspired researchers to explore deep learning techniques on traffic prediction problems. However, existing methods on traffic prediction have only considered spatial relation (e.g., using CNN) or temporal relation (e.g., using LSTM) independently.
One of the most fundamental questions for future smart cities is how to build an efficient transportation system. To address this question, a critical component is an accurate demand prediction model.
Research question
In this paper, we study the taxi demand prediction problem; that problem being how to predict the number of taxi requests for a region in a future timestamp by using historical taxi requesting data.
Review
Representatively, autoregressive in- tegrated moving average (ARIMA) and its variants have been widely applied for traffic prediction (Li et al. 2012; Moreira-Matias et al. 2013; Shekhar and Williams 2008). Based on the time series prediction method, recent stud- ies further consider spatial relations (Deng et al. 2016; Tong et al. 2017) and external context data (e.g., venue, weather, and events) (Pan, Demiryurek, and Shahabi 2012; Wu, Wang, and Li 2016). While these studies show that prediction can be improved by considering various addi- tional factors, they still fail to capture the complex nonlinear spatial-temporal correlations.
Recent studies (Zhang, Zheng, and Qi 2017; Zhang et al. 2016) propose to treat the traffic in a city as an image and the traffic volume for a time period as pixel values.
Given a set of historical traffic images, the model predicts the traffic image for the next timestamp. Convolutional neural net- work (CNN) is applied to model the complex spatial correlation. Yu et al. (2017) proposes to use Long Short Term Memory networks (LSTM) to predict loop sensor readings. They show the proposed LSTM model is capable of modeling complex sequential interactions. These pioneering attempts show superior performance compared with previous methods based on traditional time series prediction methods.
However, none of them consider spatial relation and temporal sequential relation simultaneously.
Proposed method
We propose a Deep Multi-View Spatial-Temporal Network (DMVST-Net) framework to model both spatial and temporal relations. Specifically, our proposed model consists of three views:
temporal view (modeling correlations between future demand values with near time points via LSTM),
spatial view (modeling local spatial correlation via local CNN),
semantic view (modeling correlations among regions sharing similar temporal patterns).
Result
Experiments on large-scale real taxi demand data demonstrate effectiveness of our approach over state-of-the-art methods.
Contribution
• We proposed a unified multi-view model that jointly considers the spatial, temporal, and semantic relations.
• We proposed a local CNN model that captures local characteristics of regions in relation to their neighbors.
• We constructed a region graph based on the similarity of demand patterns in order to model the correlated but spatially distant regions. The latent semantics of regions are learnt through graph embedding.
• We conducted extensive experiments on a large-scale taxi request dataset from Didi Chuxing. The results show that our method consistently outperforms the competing base-lines.
Toch, Eran, et al. “Analyzing large-scale human mobility data: a survey of machine learning methods and applications.” Knowledge and Information Systems 58.3 (2019): 501-523.
Motivation
Human mobility patterns reflect many aspects of life, from the global spread of infectious diseases to urban planning and daily commute patterns. In recent years, the prevalence of positioning methods and technologies, such as the global positioning system, cellular radio tower geo-positioning, and WiFi positioning systems, has driven efforts to collect human mobility data and to mine patterns of interest within these data in order to promote the development of location-based services and applications.
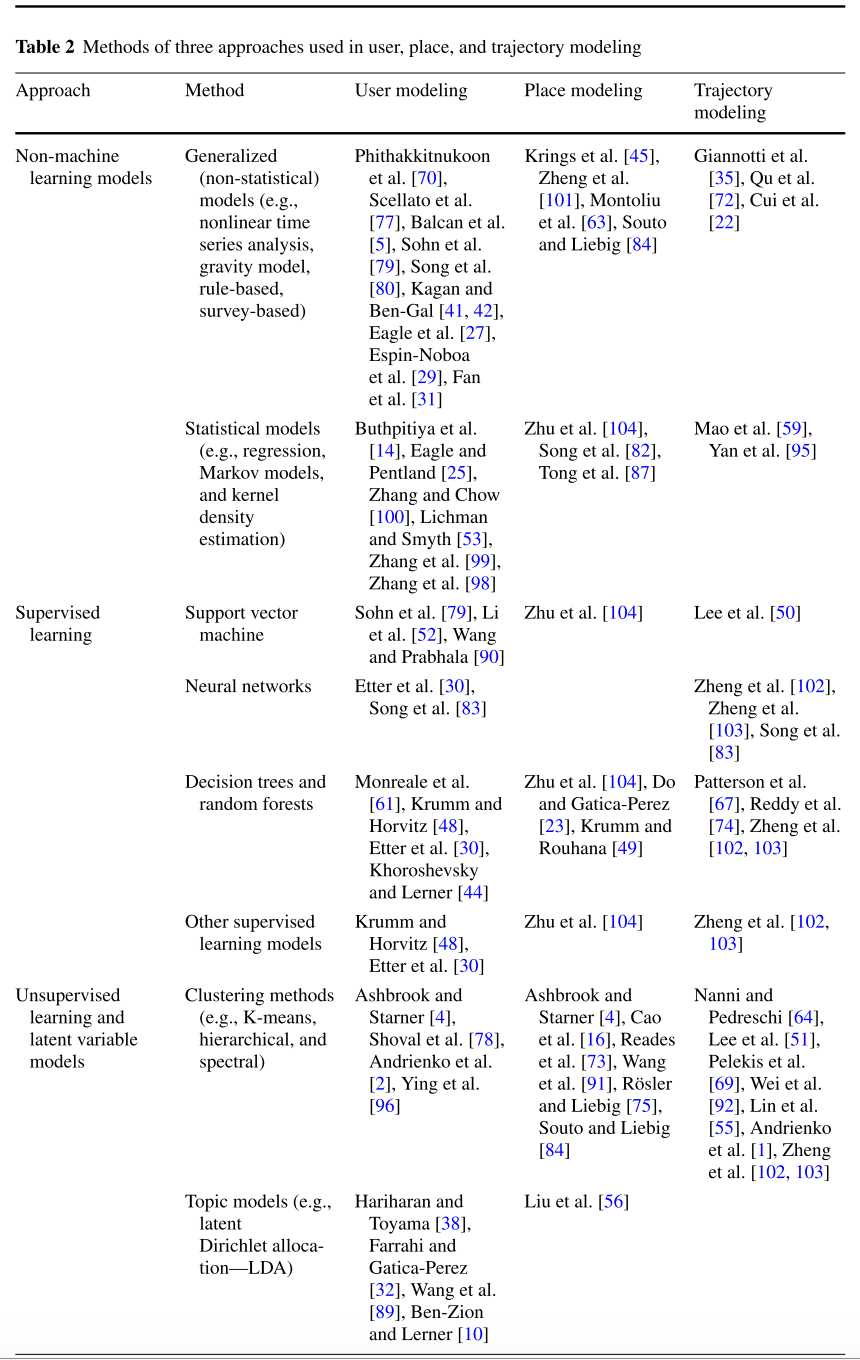
The efforts to mine significant patterns within large-scale, high-dimensional mobility data have solicited use of advanced analysis techniques, usually based on machine learning methods, and therefore, in this paper, we surveyand assess different approaches and models that analyze and learn human mobility patterns using mainly machine learning methods.
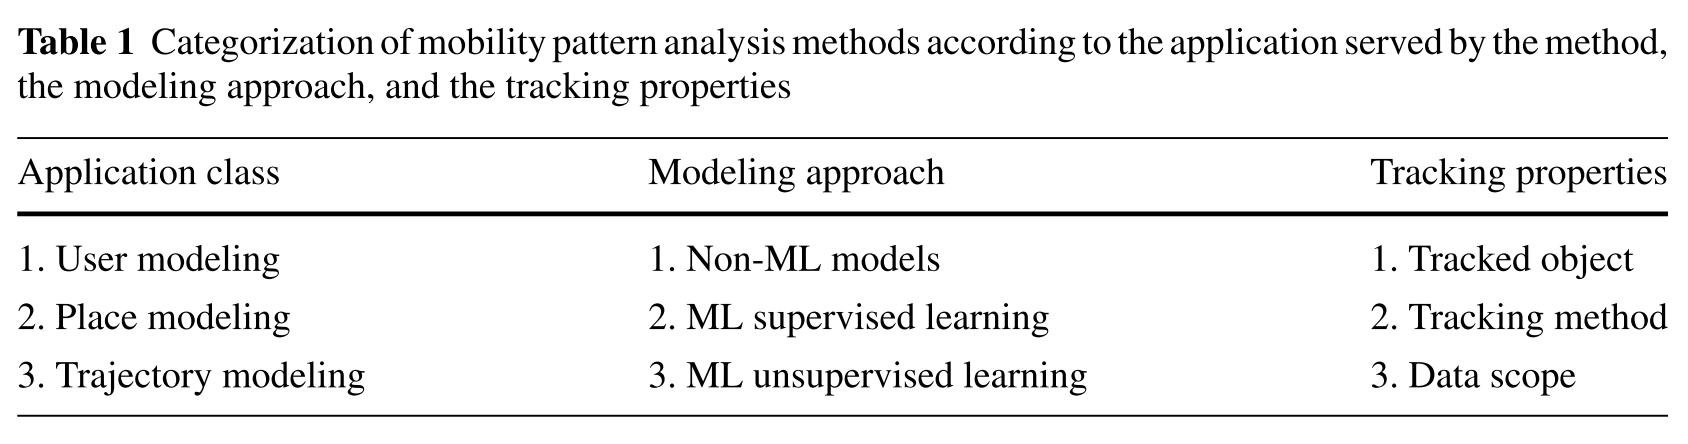
We categorize these approaches and models in a taxonomy based on their positioning characteristics, the scale of analysis, the properties of the modeling approach, and the class of applications they can serve.
We find that these applications can be categorized into three classes: user modeling, place modeling, and trajectory modeling, each class with its characteristics. Finally, we analyze the short-term trends and future challenges of human mobility analysis.
Review
Mobility data have been used to answer questions such as how people travel between cities [73]and what the patterns are of their daily commute [37, 80], as well as to predict socioeconomic trends [33], find relationships in online social networks [21], identify people’s weight and health status [65], discover employment patterns [28], and follow the spread of infectious diseases [5, 93].
Mobility data were also found to represent human behavior in catastrophic events, e.g., the 2010 Haiti earthquake [9, 57] or the 2011 Japan earthquake [31].
Models of mobility were used in designing public transportation systems [11], in taxicab allocation [43], and in performing crowd-sourcing tasks [76]. In addition, the analysis of mobility patterns leads to a growing field of commercial applications by mobile communication service providers such as Telefonica1 and Verizon,2 as well as by several companies that have already started to pro- vide location-based services analyzing mobile phone location traces.
2. Background: human mobility patterns
The first efforts to learn human mobility patterns were associated with classic social sci- ences. Since the nineteenth century, sociologists in what are called time-use or time-budget studies have been measuring the time people spend doing different activities throughout the day [85].
3. Taxonomy of mobility pattern analysis methods
3.1 Application class
User modeling applications analyze the mobility of a single user (or object) for extended periods of time (Fig. 1a). In such applications, the model can predict where a particular user will be at different times of the day. For example, in homeland security applications, targeted users can be modeled by the distribution of their geographic locations over time in order to trigger an alarm if an abnormal situation occurs.
Place modeling applications analyze the characteristics of a geographic location or a set of locations. For example, in Fig. 1b, the model can predict the number of incoming and outgoing people in a place (say a large store), profile its traffic, and classify the type of place according to the mobility patterns of people around it.
Trajectory modeling applications analyze a set of spatial–temporal points that reflect a trajectory, defined as a movement pattern through a set of locations of a single object or a set of objects and time. In contrast to user modeling, in trajectory modeling, the identities of the moving objects are not necessarily a factor in the analysis; thus, for example, all the moving objects along the modeled trajectory can be analyzed aggregately. In contrast to place modeling, the entity in trajectory modeling is a route between geographic locations, rather than a single location. For example, Fig. 1c visualizes a trajectory that may be used in modeling road segments or road networks by an application that predicts traffic conditions.
3.2 Modeling approach
3.3 Tracking properties
4 Application classes of human mobility patterns
4.1 User modeling
User modeling can also be used to categorize and cluster locations and other properties of individual users, as well as to predict themobility ofusers or clusters ofusers.
4.2 Place modeling
Methods addressing place modeling can be divided into several categories, based on the way spatial environments are defined and organized. Traditional studies of place modeling rely on specialized spatial databases that describe the underlying world map (using vector graphics representation) and define the topology and relations among different vector objects (points, lines, polygons). Typically, place modeling represents a location in its physical form using geographic coordinates or other local coordinate systems, enabling what is usually called spatial data mining (SDM) [66]. SDM is mostly used in domains such as climatology, earth science, public health, and demographic analysis in which human mobility traces augment geographic models, providing insights into how humans use the space.
Figure 5 exemplifies possible levels of place modeling. In individual place modeling (Fig. 5a), the analysis process uses location traces to identify the places users stay in [4]. The definition of a place in most research relates to a specific location or a polygon that the user remained for a meaningful period of time. In the second level of modeling (Fig. 5b), a place is modeled statistically based on visitation patterns of users in this place [15]. Semantic place modeling (Fig. 5c) analyzes the semantic properties of places, such as “residential” or “commercial” [104]. Finally, activity-based place modeling (Fig. 5d) provides semantic annotation that individuals give to a place they visit according to their activity in this place, such as “studying” or “shopping” [49].
The first level of individual place modeling requires abstraction of the physical location data. Without abstraction, the continuous, high precision location data do not allow a simple extraction ofmobility patterns. Some high-level analysis relies on straightforward geographic definitions, such as of countries, states, cities, and neighborhoods. For example, Krings et al. [45] provided a statistical analysis of the relationships between cities, modeling people’s movement between cities using a gravity function. A more detailed abstraction is often the partitioning of the geographic space into (uniquely) labeled segments so the location of waypoints falling within a segment can be replaced with the segment label [63]. While partitioning is an abstraction, it retains the essential spatial attributes (aswell as shortcomings) of the physical locations. For example, two waypoints that are very far apart will generally be assigned different labels even if both fit the same semantic label (e.g., two restaurants).
In statistical place modeling, information about people’s visits to a particular place is accumulated and analyzed using statistical tools such as regression and distribution plots. Reades et al. [73] divided Rome into even-sized areas of 250,000 square meters and described each area according to distinct patterns of visitation. While the method portrays the dynamic of a city through a large-scale data analysis, the fact that the analysis was done for an arbitrary division of the urban environment limits the type of knowledge that can be derived from such analysis. In contrast, studies such as Krishnamachari et al. [46] and Xiao et al. [94] investigated how knowledge about human mobility can be used to divide urban areas into meaningful sub-areas, finding that dividing areas into even sizes (polygons of cells) is less effective than dynamic area allocation based on users’ mobility. Other studies focused on finding significant places from mobility analysis using clustering methods [1, 38].
Semantic place modeling provides a higher level ofabstraction and, like semantics in other fields, abstracts different geographic granularities of a place. For example, several waypoints located in a classroom on a university campus might be labeled “Room No. 438,” “Engineer- ing Building,” or “University Campus.” These labels represent different categorizations of places according to some predefined semantics. Yan et al. [95] suggest using hidden Markov models to infer the semantic labels ofa place, where the hidden states represent the categories ofthose places. Zhu et al. [104] used several methods, e.g., L1-norm logistic regression, SVM, gradient boosted trees, and random forest to attach semantic labels to places.
Finally, place modeling can be based on user activity that is carried out in a certain place. Then, two persons in the same place, say a class, a teacher and a student, will label this place differently, e.g. “Work” and “School,” respectively [49]. Zaslavsky et al. [97]present a framework that gathers data from many sensors, including low-level wearable sensors, to label activities in different granularities.
4.3 Trajectory modeling
5 Future challenges and conclusions
5.1 Standardized and succinct mobility models
When reviewing the literature of mobility analysis, we could not find an emergent model that can be used for standardizing location trace storage or analysis processes.
5.2 End user applications
Most of the industrial applications that currently rely on big mobility data are geared toward providing large and small businesses and organizations with statistical data.
5.3 Data labeling
A major challenge for future research is the ability to draw and learn meaningful models from mobility datasets.
5.4 Privacy threats
Collecting, storing, and analyzing location traces have significant privacy implications.
Rong L, Cheng H, Wang J. Taxi Call Prediction for Online Taxicab Platforms[C]//Asia-Pacific Web (APWeb) and Web-Age Information Management (WAIM) Joint Conference on Web and Big Data. Springer, Cham, 2017: 214-224.
Motivation
The online taxi-calling services have gained great popular- ity in the era of sharing economy. Comparing with the traditional taxi service, the online taxi-calling service is much more convenient and flex- ible for passengers, because the taxi platform can provide detailed travel arrangements, transparent estimated price and flexible means of calling in advance. To understand the call willingness of passengers and to increase the quantity of orders, it is important to predict whether a request will be converted to a call order.
Taxi calling prediction information benefit the platforms in triple ways.
(i) Evaluating price mechanisms. TCR reflects the willingness of passengers to travel by taxi after the platform adopts new price mechanisms and discount strategies.
(ii) Expanding potential market. By observing historical data, the platforms can discover times and regions with low TCR, which have room for growth.
(iii) Customizing individual needs. The platforms can learn passenger behaviors from user historical records, and then choose the most suitable prices and the best travel scheme for users. Therefore, TCP is a foundational issue in large-scale online taxi industries.
Research question
we want to predict whether a request will be converted to a call order.
Review
The taxi demand prediction studies the problem of forecasting the demands in every pick up location, which can further guide and optimize the taxi dispatching [11] and task assignment in location-based services [9,10]. Moreira-Matias et al. [7] design a model to predict the number of future services at a given taxi stand, where the GPS traces and event signals are transformed into a time series of interest as both a learning base and a streaming test framework. Recently, Tong et al. [8] propose a simple unified linear regression approach with massive combi- national features to estimate real-time taxi demands, which successfully uses fea- ture engineering methods to improve the accuracy of the taxi demand prediction. Above works only studied the demand prediction, and there are some research predicting the the supply-demand. Anwar et al. [1] combine the trajectories of taxi and flight arrival data to predict the unmet taxi demands, which means the gap between taxi demands and potential supply of taxicabs at airports. Dong et al. [12] predict the equilibrium of the supply-demand, and use environment data such as the weather or traffic conditions to enhance the prediction accuracy. Both demand prediction and supply-demand prediction are regression problems essentially, they predict the number of taxi demand or demand gap in a period of time at an area, hence it is impossible to extend works on demand prediction to TCP.
Data Description
The original taxi order records of the Beijing dataset are sampled in proportion from Didi. The Beijing raw dataset contains 23,851,235 original taxi order records from July 1, 2016 to December 31, 2016.
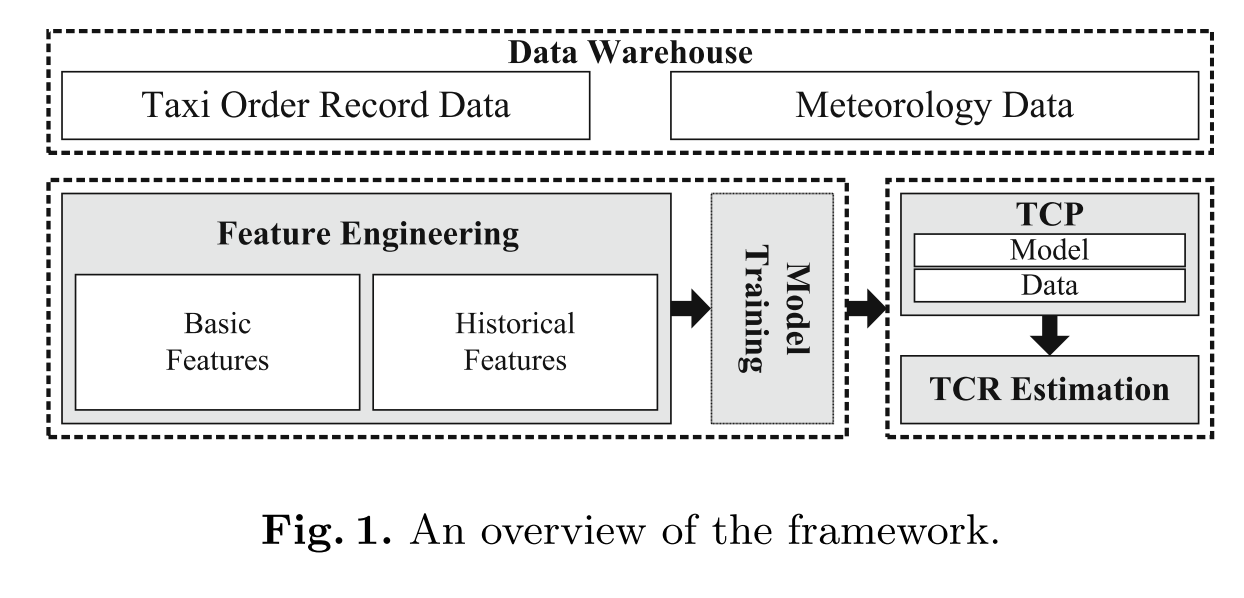
Proposed method
To solve the problem of TCP, we propose a unified TCP framework with some classification models and spatio-temporal features. Figure 1 illustrates the overview of the framework. We first investigate multiple real-world datasets including taxi records and meteorology. Then we extract four types of basic features over time, space, money and meteorology domains to train models as a basic version. And we present an advanced version by generating user person- alized historical features based on the understandings of the business logics of online taxicab platforms.
Feature Engineering
Basic Features
- Temporal Features
- Spatial Features
- Monetary Features
- Meteorological Features
Contribution
To the best of our knowledge, this is the first effort on the prob- lem of taxi call prediction for large-scale online taxicab platforms. We transform the overhead of sophisticated model redesign into feature engineering, and apply three state-of-the-arts classification models for training and testing. We con- duct extensive experiments on two real datasets from the largest online taxicab platform in China. The experimental results show that our prediction models perform well.
Wang D, Cao W, Li J, et al. DeepSD: supply-demand prediction for online car-hailing services using deep neural networks[C]//2017 IEEE 33rd International Conference on Data Engineering (ICDE). IEEE, 2017: 243-254.
Motivation
The online car-hailing service has gained great popularity all over the world. As more passengers and more drivers use the service, it becomes increasingly more important for the the car-hailing service providers to effectively schedule the drivers to minimize the waiting time of passengers and maximize the driver utilization, thus to improve the overall user experience.
Research question
In this paper, we study the problem of predicting the real-time car-hailing supply-demand, which is one of the most important component of an effective scheduling system. Our objective is to predict the gap between the car-hailing supply and demand in a certain area in the next few minutes. Based on the prediction, we can balance the supply-demands by scheduling the drivers in advance.
If one could predict/estimate how many passengers need the ride service in a certain area in some future time slot and how many close-by drivers are available, it is possible to balance the supply-demands in advance by dispatching the cars, dynamically adjusting the price, or recommending popular pick-up locations to some drivers.
our goal is to predict the gap between the car-hailing supply and demand (i.e., max(0, demand − supply)) for a certain area in the next few minutes.
Review
Treating the order data separately and creating many sub- models are tedious, and may suffer from the lack of training data since each sub-model is trained over a small part of data.
feature engineering typically requires substantial human efforts (it is not unusual to see data science/ machine learning practitioners creating hundreds different features in order to achieve a competitive performance) and there is little general principle how this should be done.
Moreover, the supply-demand patterns change from day to day. There are many other complicated factors that can affect the pattern, and it is impossible to list them exhaustively. Hence, simply using the average value of historic data or empirical supply-demand patterns can lead to quite inaccurate prediction results, which we show in our experiments.
Proposed method
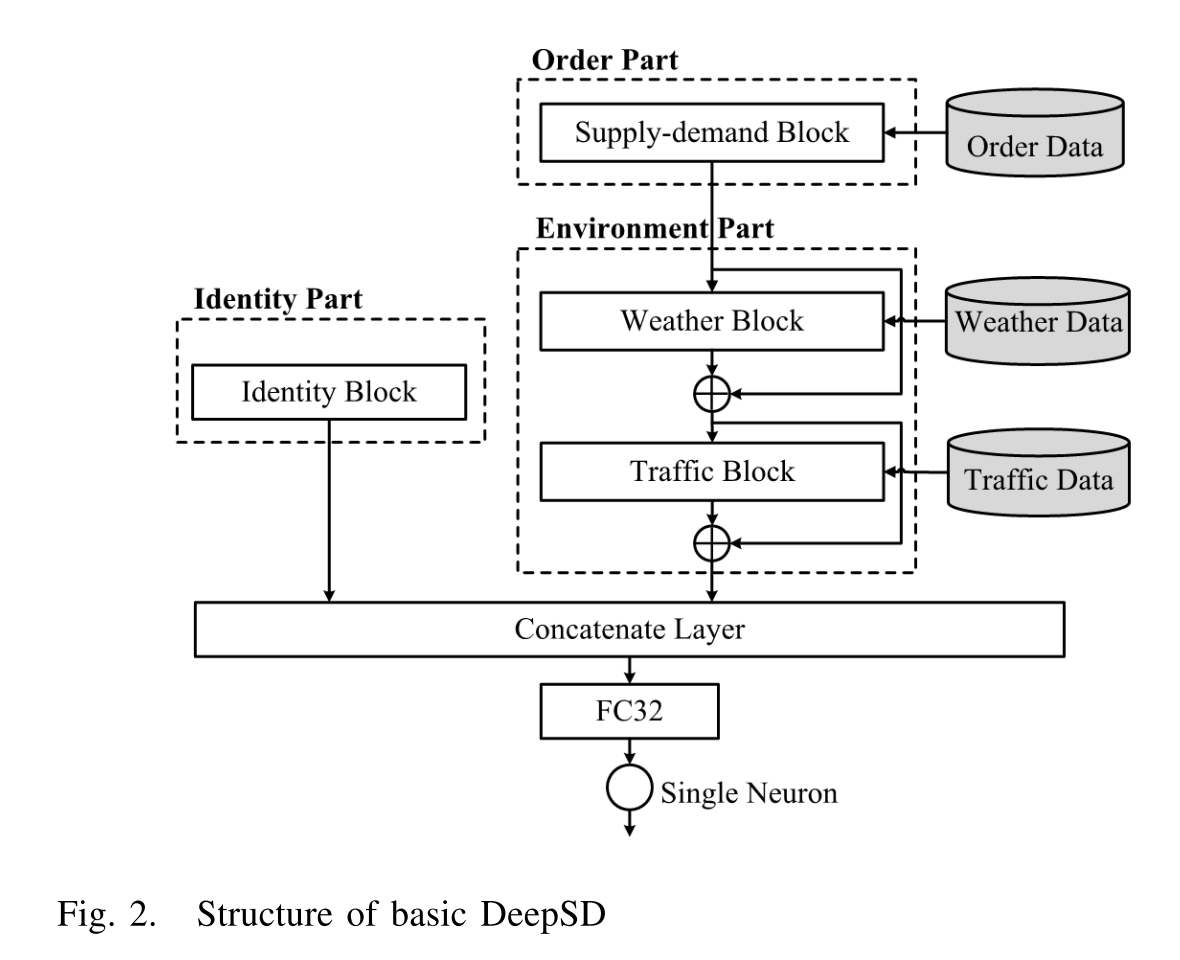
We present an end-to-end framework called Deep Supply-Demand (DeepSD) using a novel deep neural network structure. Our approach can automatically discover complicated supply-demand patterns from the car-hailing service data while only requires a minimal amount hand-crafted features. Moreover, our framework is highly flexible and extendable. Based on our framework, it is very easy to utilize multiple data sources (e.g., car-hailing orders, weather and traffic data) to achieve a high accuracy. We conduct extensive experimental evaluations, which show that our framework provides more accurate prediction results than the existing methods.
Contribution
We proposed an end-to-end framework based on a deep learning approach. Our approach can automatically learn the patterns across different spatio-temporal attributes (e.g. geographic locations, time intervals and days of week), which allows us to process all the data in a unified model, instead of separating it into the sub-models manually. Comparing with other off-the-shelf methods (e.g., gradient boosting, random forest [10]), our model requires a minimal amount feature-engineering (i.e., hand-crafted features), but produces more accurate prediction results.
We devise a novel neural network architecture, which is inspired by the deep residual network (ResNet) proposed very recently by He et al. [11] for image classification. The new network structure allows one to incorporate the “environment factor” data such as the weather and traffic data very easily into our model. On the other hand, we can easily utilize the multiple attributes contained in the order data without much information loss.
We utilize the embedding method [9], [12], a popular technique used in natural language processing, to map the high dimensional features into a smaller subspace. In the experiment, we show that the embedding method enhances the prediction accuracy significantly. Furthermore, with embedding, our model also automatically discovers the similarities among the supply-demand patterns of different areas and timeslots.
We further study the extendability of our model. In real applications, it is very common to incorporate new extra attributes or data sources into the already trained model. Typically we have to re-train the model from the scratch. However, the residual learning component of our model can utilize these already trained parameters by a simple fine tuning strategy. In the experiment, we show that the fine-tuning can accelerate the convergence rate of the model significantly
Finally, we conduct extensive experiments on a large scale real dataset of car-hailing orders from Didi. The experimental results show that our algorithm outperforms the existing method significantly. The prediction error of our algorithm is 11.9% lower than the best existing method.
Zhu, Yin, et al. “Feature engineering for place category classification.” Workshop on the Nokia Mobile Data Challenge. 2012.
Motivation
Mobile Data Challenge (MDC) Task 1 is to infer the category of a place using the smartphone sensing data obtained at the place.
Juha K. Laurila, Daniel Gatica-Perez, Imad Aad, Jan Blom, Olivier Bornet, Trinh-Minh-Tri Do, Olivier Dousse, Julien Eberle, and Markus Miettinen. The Mobile Data Challenge: Big Data for Mobile Computing Research. In Proc. Mobile Data Challenge by Nokia Workshop, in conjunction with Int. Conf.. on Pervasive Computing, Newcastle, June 2012.
Data
Nokia MDC releases all the sensor data in the raw form, which provides us the possibility to extract best features ourselves.
Proposed method
Our main strategy is to extract as many useful features as we can from the sensor data, and build good classifiers using these features. By useful, we mean features that have discriminability among the ten location categories. Once the features are generated, we use state-of-the-art classifiers, e.g. SVM and Decision Trees, to decide how to form rules for place category classification.
CONDITIONAL FEATURES
FEATURE ENGINEERING
- Time features
- Accelerometer features
- Application features
- Bluetooth and Wlan features
- Calllog features
- System features
- Media feature
- Bag-of-Words (BoW) features
FEATURE SELECTION AND CLASSIFIER BUILDING
- Logistic regression (LogReg)
- Support Vector Machines (SVM)
- Gradient Boosted Trees (GBT)
- RandomForest (RF)
Contribution
-
We propose the Conditional Feature method to explore the relationship among features. And in our experiments, we find that time conditions are very useful in place type classification.
-
We analyze what features are useful for place type prediction. Although most of the features are already proposed in the literature, our work is a systematic analysis on their usefulness in this specific task, therefore provides important insights on place type prediction.
Zheng, Vincent W., et al. “Collaborative location and activity recommendations with GPS history data.” Proceedings of the 19th international conference on World wide web. ACM, 2010.
Motivation
With the increasing popularity of location-based services, such as tour guide and location-based social network, we now have accumulated many location data on the Web.
Our research is highlighted in the following location-related queries in our daily life:
1) if we want to do something such as sightseeing or food-hunting in a large city such as Beijing, where should we go?
2) If we have already visited some places such as the Bird’s Nest building in Beijing’s Olympic park, what else can we do there?
In general, the first question corresponds to location recommendation given some activity query (where “activity” can refer to various human behaviors such as food-hunting, shopping, watching movies/shows, enjoying sports/exercises, tourism, etc.), and the second question corresponds to activity recommendation given some location query.
We show to put both location recommendation and activity recommendation together in our knowledge mining, since locations and activities are closely related in nature.
it is not easy to obtain such a complete location-activity matrix for location and activity recommendations from the raw GPS data due to the following reasons:
1) the ratings in such a location-activity matrix are not easy to get from the raw GPS data with merely location coordinates and timestamps. Recall that a rating in the matrix denotes how often an activity is performed in a location, so we may need to know what each user did on that location to get a rating.
2) Based on the previous reason, we can only get a very sparse location-activity matrix (e.g. in our dataset, we have less than 0.6% entries with non-missing values), so it is difficult to do recommendations with such limited information.
Proposed method
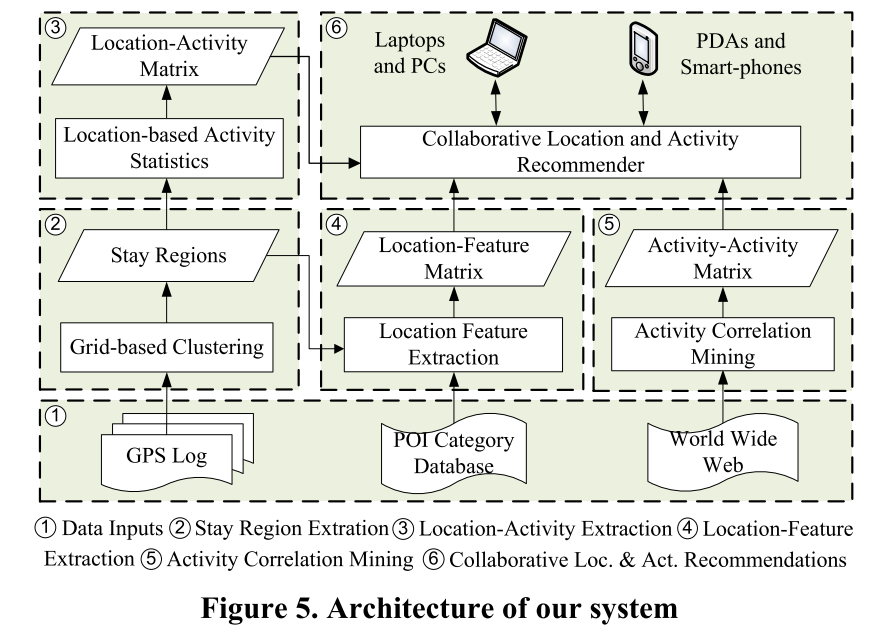
Stay Region Extraction
Location-Activity Information Extraction
Location-Feature Extraction
Activity-Activity Correlation Extraction
COLLABORATIVE LOCATION AND ACTIVITY RECOMMENDATIONS
Contribution
We put forward a new problem for collaborative location and activity recommendations based on the GPS history data, so that we can provide more specific recommendations with location or activity constraints.
We propose to exploit location features and activity-activity correlations for collaborative filtering, so as to address the data sparsity problem of the GPS histories. We also show how to well incorporate this additional information with the incomplete location-activity matrix in a collective matrix factorization model for final recommendations.
We evaluate our system using a large GPS dataset, which was collected by 162 users over a period of 2.5 year in the real world. The number of GPS points is around 4 million and its total distance was over 139,310 kilometers.
Souto G, Liebig T. On event detection from spatial time series for urban traffic applications[M]//Solving large scale learning tasks. Challenges and algorithms. Springer, Cham, 2016: 221-233.
Motivation
Since the last decades the availability and granularity of location-based data has been rapidly growing. Besides the proliferation of smartphones and location-based social networks, also crowdsourcing and voluntary geographic data led to highly granular mobility data, maps and street networks.
In result, location-aware, smart environments are created. The trend for personal self-optimization and monitoring named by the term ‘quantified self’ will speed-up this ongoing process. The citizens in conjunction with their surrounding smart infrastructure turn into ‘living sensors’ that monitor all aspects of urban living (traffic load, noise, energy consumption, safety and many others). The “Big Data”- based intelligent environments and smart cities require algorithms that process these massive amounts of spatio-temporal data.
research question
This article provides a survey on event processing in spatio-temporal data streams with a special focus on urban traffic.
In the paper at-hand we provide a introductory survey on
(1) functions on heterogeneous spatio-temporal data streams, Sect. 2,
(2) pattern matching, Sect. 3,
(3) anomaly detection in spatio-temporal time series, Sect. 4,and
(4) streaming frameworks, Sect. 5.
All four aspects are relevant for implementing real-world event detection systems that process heterogeneous data streams.
Function Classes on Heterogeneous Spatio-Temporal Time Series
spatial functions split into four groups: local, focal, zonal and global ones [5], illustrated in Fig. 1.
– Local functions operate on every single cell in a layer. And the cell is processed without reference to surrounding cells. An example is a map transformation, the multiplication with a constant, or the comparison with a threshold.
– Focal functions process cell data depending on the values of neighboring cells. The neighborhood can be defined by arbitrary shapes. Example functions are moving averages and nearest neighbor methods.
– Zonal functions process cells on the base of zones, these are cells that hold a common characteristic. Zonal functions allow the combination of heteroge- neous data streams in various layers by application of functions to one layer if another layer already fulfills another condition.
– Global functions process the entire data. Examples are distance based opera- tions. For
Event Pattern Matching
The exploitation of spatio-temporal event patterns is a major research field in mobility mining.
The requirements for spatio-temporal pattern matcher in a smart city scenario are:
– to operate in real time,
– to incorporate spatial [28] and temporal [2] relations
– to provide local, focal, zonal, and global [5] predicates on the attributes,
– to pose arbitrary queries formed of these elements (regular language [23], Kleene closure [18]).
The temporal expressiveness is split into the following four categories:
– Pattern Duration is a constraint on the temporal distance of first and last condition in a pattern.
– Condition Duration is a constraint on the duration of a condition to get matched.
– Inter-Condition Duration is a constraint on the temporal distance among suc- ceeding conditions.
– Complete indicates the complete integration of the temporal relations [2].
Anomaly Detection on Spatial Time Series
Statistical Approach
Human/Driver’s Behavior
Unsupervised
Tree Approach
Useful information
Early detection of anomalies in spatio-temporal data streams provides many applications for smart cities and is a major research topic since the availabil- ity and granularity of location-based data has been rapidly growing in the last decades.
The “Big Data”-based intelligent environments and smart cities require algorithms that process these massive amounts of spatio-temporal data in real-time. But key challenges for streaming analysis are (1) one-pass processing (2) limited amount of memory and (3) limited time to process [6].
In principle, there are three types of spatio-temporal data streams [19]: spatial time series, events,and trajectories.
–A spatial time series consists of tuples (attribute, object, time, location).
–An event of a particular type eventi is triggered from a spatial time series under certain conditions and contains the tuples verifying these conditions (eventi,objectn,timen,locationn).
–A trajectory is a spatial time series for a particular objecti. It contains the location per time and is a series of tuples (objecti,timen,locationn).
Detecting events in spatio-temporal data is a widely investigated research area (see e.g. [1] for an overview)
Pillac V, Guéret C, Medaglia A L. An event-driven optimization framework for dynamic vehicle routing[J]. Decision Support Systems, 2012, 54(1): 414-423.
Motivation
The real-time operation of a fleet of vehicles introduces challenging optimization problems.
Proposed method
In this work, we propose an event-driven framework that anticipates unknown changes arising in the context ofdynamic vehicle routing. The framework is intrinsically parallelized to take advantage ofmodern multi-core and multi-threaded computing architectures. It is also designed to be easily embeddable in decision support systems that copewith a wide range ofcontexts and side constraints. We illustrate the flexibility ofthe framework by showing how it can be adapted to tackle the dynamic vehicle routing problem with stochastic demands.
Chang H, Tai Y, Hsu J Y. Context-aware taxi demand hotspots prediction[J]. International Journal of Business Intelligence and Data Mining, 2010, 5(1): 3.
Motivation
In an urban area, the demand for taxis is not always matched up with the supply.
According to the Institute of Transportation (IOT) Survey of Taxi Operation Conditions in Taiwan Area 2006, in average, each taxi driver operated the business 9.9 h a day, driving approximately 147.3 km. However, about one-third of the time, 3.2 h, drivers were on the roads without taking passengers. The time and energy wasting phenomenon is more severe in Taipei urban area. Taipei City Department of Transportation reported that in over 60–73% of their operation hours, taxi drivers were driving without passengers. This roaming situation not only wastes energy but pollutes the environment.
One of the reasons for driving an unoccupied vehicle is that taxi drivers do not know where potential customers are, leaving them with no choice but to wander around the city. The goal of this research is to predict the areas with potential demand from contexts and past history.
Related work
Our work is different from the above in that GPS trace records have strong spatial-temporal continuity, but taxi request records are not. In addition, GPS traces are from individuals and more personalised, while taxi requests are with less personalised factor.
OptiTaxi2 is a taxi management service provided by Correlation Systems Ltd. OptiTaxi predicts the demand for taxi services according to locations and time, attemping to maximise profits of the entire taxi fleet. However, the locations as the units of demand prediction are pre-defined and fixed in the OptiTaxi system. In our work, we adopt clustering techniques to dynamically generate the areas from the demand history.
Proposed method
This paper proposes mining historical data to predict demand distributions with respect to contexts of time, weather, and taxi location. The four-step process consists of data filtering, clustering, semantic annotation, and hotness calculation. The results of three clustering algorithms are compared and demonstrated in a web mash-up application to show that context-aware demand prediction can help improve the management of taxi fleets.
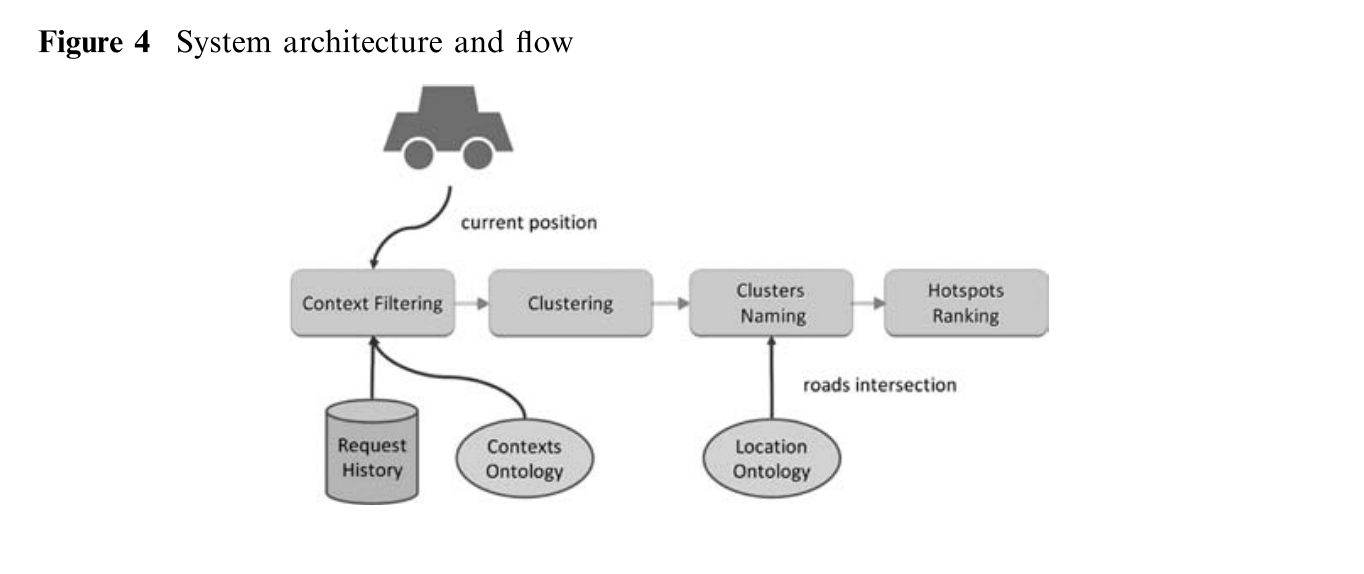
Data
The current location dataset is built based on the research data version 1.4 provided by the Institute of Transportation (IOT), MOTC, Taiwan. http://www.iot.gov.tw/english/ct.asp?xItem=187765&ctNode=2272
Contribution
The contribution of this work is an application to solve the context-aware pattern mining from taxi request records by adapting existing approaches from clustering. Through the process, customer demand can be understood
Chang H, Tai Y, Chen H, et al. iTaxi: Context-aware taxi demand hotspots prediction using ontology and data mining approaches[J]. Proc. of TAAI, 2008.
Motivation
It has been estimated that over 60 thousand licensed taxis in the Great Taipei area are not occupied over 70 percent of driving time on average. However, the taxi company, TaiwanTaxi, indicates that even in rush hour, there are customers whose requests are not satisfied. The demand and supply are not paired, causing not only customers wait too long for a cab, but also taxi drivers waste time and fuel to wander around the streets.
Rodrigues F, Markou I, Pereira F C. Combining time-series and textual data for taxi demand prediction in event areas: a deep learning approach[J]. Information Fusion, 2019, 49: 120-129.
Motivation
Accurate time-series forecasting is vital for numerous areas of application such as transportation, energy, fi- nance, economics, etc. However, while modern techniques are able to explore large sets of temporal data to build forecasting models, they typically neglect valuable information that is often available under the form of un- structured text. Although this data is in a radically different format, it often contains contextual explanations for many of the patterns that are observed in the temporal data.
typical approaches focus only on capturing recurrent mobility trends that relate to habitual/routine behaviour [1], and on exploiting short-term corre- lations with recent observation patterns [2,3]. While this type of ap- proaches can be successful for long-term planning applications or for modeling demand in non-eventful areas such as residential neighbor- hoods, in lively and highly dynamic areas that are prone to the occurrence of multiple special events, such as music concerts, sports games, festivals, parades and protests, these approaches fail to accurately model mobility demand [4].
In order to capture the effects of events, one can exploit the vast amount of information that is shared online about what is planned to take place in the city. However, most of this information is typically in the form of unstructured natural-language text. Solving this cross-domain data fusion challenge then becomes key for understanding the mobility demand patterns that are caused by events, and also for addressing the general class of problems where text data from the Web can provide the context for explaining some of the patterns that are ob- served in time-series data. These, not only are quite ubiquitous and cover various research fields, but they are becoming increasingly re- levant as people share more and more information online. Popular examples include the use of text data from online social media to help predict opinion polls [5] and financial time-series (e.g. stock markets [6,7]).
none of the previous approaches explore Web data about events, particularly in the form of unstructured text, in order to develop more accurate demand forecasting models.Data
a large-scale public dataset of 1.1 billion taxi trips from New York [11] and event data from the Web.
we make the source code and datasets used in our experiments publicly available, thus setting them as a data fusion benchmark, so that other researchers can build upon our proposed methodology and use it as a baseline for developing other data fusion methods for the domain application considered in this work.The base dataset for our experiments consists of 1.1 billion taxi trips from New York (January 2009 to June 2016) that were made publicly available by the NYC Taxi & Limousine Commission [11]. Based on this data, we looked at a list of the top venues in NYC [37] and selected the two venues for which more complete event records where available online: the Barclays Center and Terminal 5. Located in Brooklyn, the Barclays Center is modern multi-purpose arena with 18.000 seats that regularly hosts major musical performances and serves as the new home of the NBA’s Brooklyn Nets. On the other hand, the Terminal 5 is a 3- floor venue that regularly hosts concerts with many different audiences and that is located in the heart Manhattan. Given the geographical coordinates of these two venues, we selected all the taxi pickups that took place within a bounding box of ± 0.003 decimal degrees (roughly 500 m) to be our study areas. Fig. 5 shows a map of these areas.
The weather data was obtained from the National Oceanic and Atmospheric Administration (NOAA) and corresponds to measurements from a weather station located in the Central Park in NYC.
Regarding the event data, it was extracted automatically from the Web using either screen scrapping techniques or API’s. For the Barclays Center, the event information was scrapped from its official website, since it maintains a very accurate and detailed calendar that allowed us to go back in time and retrieve data for the period matching the taxi demand data. We collected a total of 751 events since its inauguration in late 2012 until June 2016. As for the Terminal 5, we used the Facebook API to extract 315 events for a similar time period. In both cases, the event data includes event title, date, time and description. It is important to note that, in practice, one could easily use one of the many event directories and aggregators available online, such as Eventful.com, Timeout.com, etc. Our choice to rely on these specific ones was to facilitate the retrieval of past events, which is typically not available.
Related work
Urban mobility and special events
Urban mobility demand forecasting under special events has long been recognized to be more difficult than under habitual or recurrent conditions [12].
for large-scale events (e.g. World cup, Formula 1 and Olympic games), best practices are already available for authorities to follow in order to manage these events and prepare for them well in advance [13,14]. Unfortunately, these manual approaches do not scale to the vast amount of smaller and medium-sized events that take place on large metropolitan areas on a daily basis.
most of the relevant event information is typically available in the form of unstructured text.
Chen Y, Xu L, Liu K, et al. Event extraction via dynamic multi-pooling convolutional neural networks[C]//Proceedings of the 53rd Annual Meeting of the Association for Computational Linguistics and the 7th International Joint Conference on Natural Language Processing (Volume 1: Long Papers). 2015, 1: 167-176.
Motivatioin
Traditional approaches to the task of ACE event extraction primarily rely on elabo- rately designed features and complicated natural language processing (NLP) tools. These traditional approaches lack gener- alization, take a large amount of human effort and are prone to error propaga- tion and data sparsity problems.
Proposed method
This paper proposes a novel event-extraction method, which aims to automatically ex- tract lexical-level and sentence-level fea- tures without using complicated NLP tools. We introduce a word-representation model to capture meaningful semantic reg- ularities for words and adopt a framework based on a convolutional neural network (CNN) to capture sentence-level clues. However, CNN can only capture the most important information in a sentence and may miss valuable facts when considering multiple-event sentences. We propose a dynamic multi-pooling convolutional neu- ral network (DMCNN), which uses a dy- namic multi-pooling layer according to event triggers and arguments, to reserve more crucial information. The experimen- tal results show that our approach signif- icantly outperforms other state-of-the-art methods.
Event Extraction Task
In this paper, we focus on the event extraction task defined in Automatic Content Extraction1 (ACE) evaluation, where an event is defined as a specific occurrence involving participants. First, we in- troduce some ACE terminology to understand this task more easily:
• Event mention: a phrase or sentence within which an event is described, including a trigger and arguments.
• Event trigger: the main word that most clearly expresses the occurrence of an event (An ACE event trigger is typically a verb or a noun).
• Event argument: an entity mention, temporal expression or value (e.g. Job-Title) that is involved in an event (viz., participants).
• Argument role: the relationship between an argument to the event in which it participates.
Corsar D, Markovic M, Edwards P, et al. The transport disruption ontology[C]//International Semantic Web Conference. Springer, Cham, 2015: 329-336.
Motivation
One such challenge is minimising the impact of transport disruptions [4]: road congestion is estimated to cost an average of 1% of GDP across the European Union [4], while the absence of real-time information about the impact of disruptions is a major factor in the dissatisfaction with, and reduced attractiveness of public transport [10,11]. However, tackling such problems requires addressing the challenges of data interoperability, analysis, information extraction, and reasoning presented by such environments - challenges that Semantic Web and linked data are key technologies in overcoming [9].
Related work
Along with semantic models of public transport routes and schedules provided by the Transit and GTFS25 ontologies, models have also been defined for other aspects of the transport domain. These include the Road Traffic Management Ontology26, the scope of which is limited to describing the actions a moving vehi- cle can perform (e.g. accelerate, change lane), and its relation to other vehicles (e.g. relative speed, road position). The draft Road Accident Ontology27 mod- els road accidents in terms of the vehicles and living beings involved, relevant documents (e.g. driver licence, insurance certificate), location, and organisations (e.g. insurance companies). However, it is limited to only defining a single type of event (road accident) and does not consider any consequential impact. The Passim ontology28 models systems that convey transport information to trav- ellers. Passim models such systems in terms of name, how it is accessed (website, SMS, mobile application), and coverage in terms of the modes of transport and towns, cities, and geographic regions that information is provided for.
Proposed method
Following linked data publishing best practise [5], Linked Open Vocabularies2 and the Linked Open Data3 cloud were reviewed to identify existing ontologies that could be used to meet these requirements. The selected ontologies and their integration with the Transport Disruption ontology are discussed below.
This paper presents the Transport Disruption ontology, a formal framework for modelling travel and transport related events that have a disruptive impact on traveller’s journeys. We discuss related mod- els, describe how transport events and their impacts are captured, and outline use of the ontology within an interlinked repository of the travel information to support intelligent transport systems.
Contribution
Ontologies provide a key technology for supporting data integration. Alignment of the Transport Disruption ontology with existing models, such as Event, FOAF, Transit, and LinkedGeoData extends the existing semantic modelling capabili- ties for integrated mobility data sets. The Transport Disruption ontology enables descriptions of travel and transport related events and their disruptive impacts on mobility. The defined event types and details of their impacts can be extended as necessary for use in different applications. As such, we argue that the Trans- port Disruption ontology provides a necessary component in enabling the con- tribution of Semantic Web efforts to addressing the mobility challenges faced by society today and in future smart cities. Along with the future work discussed above, we plan further evaluation of the ontology through use cases explored in collaboration with the Semantic Web and transport research communities.
Zhao K, Khryashchev D, Freire J, et al. Predicting taxi demand at high spatial resolution: approaching the limit of predictability[C]//Big Data (Big Data), 2016 IEEE International Conference on. IEEE, 2016: 833-842.
Motivation
In big cities, taxi service is imbalanced [1]. While in some areas passengers experience long waits for a taxi, in others, many taxis roam without passengers. This imbalance leads to profit loss for taxi companies, since vehicles are vacant even when there is demand. Besides, it reduces the level of the passenger satisfaction due to long wait times. The ability to predict taxi demand can help address the taxi-service imbal- ance problem. Knowledge of where a taxi should be traveling can bring benefits to both taxi drivers and companies: taxi drivers can drive to high taxi demand areas, and taxi companies (e.g, Uber) may re-allocate their vehicles in advance to meet the passenger demand.
Research question
-
Given a predictive algorithm α, considering both the randomness and temporal correlation of the taxi demand sequence, what is the upper bound of the potential accuracy that a predictive algorithm α can reach?
-
Given an upper bound of potential accuracy, which predictor has a better performance given the trade-off between the computation time and the accuracy?
Proposed method
A. Markov Predictor
B. Lempel-Ziv-Welch (LZW) predictor
C. Neural Network Predictor
Contribution
• We measure the theoretical maximum predictability of the taxi demand for each building block in NYC. This represents the upper bound of the potential accuracy that a predictive algorithm α can reach. We show that the maximum predictability of the taxi demand can reach up to 83% on average. The maximum predictability captures the degree of the temporal correlation of the taxi demand sequence. Our findings indicate that taxi demand in NYC has a strong temporal patterns.
• We implement and compare the prediction accuracy of three predictors: the Markov predictor (a probability- based method) [12], the Lempel-Ziv-Welch (LZW) pre- dictor (a sequence-based method) [13], and the Neu- ral Network (NN) predictor (a machine learning-based method) [7]. We observe that the NN predictor provides better accuracy for building blocks with low predictabil- ity, and the Markov predictor provides better accuracy for building blocks with high predictability. Our findings indicate that the maximum predictability is an approach- able target for actual prediction accuracy and a compute- intensive NN predictor with multiple features does not always outperform a simpler Markov predictor.
• We show that knowledge of the predictability at each building block can help determine which predictor to use, while taking accuracy and computational cost into consideration. Most of the previous research does not consider the heterogeneity of the predictability in dif- ferent regions and uniformly applies the same prediction method, and this can lead to inefficiencies. For example, a Markov-based predictor is four orders of magnitude faster (with only 0.03% computation time) than a computing- intensive NN predictor.
Li X, Pan G, Wu Z, et al. Prediction of urban human mobility using large-scale taxi traces and its applications[J]. Frontiers of Computer Science, 2012, 6(1): 111-121.
Motivation
much information regarding human mobility, such as location, motion, and behaviors of vehicles, is becoming easily accessible. From these digital footprints, it is feasible for researchers to extract social and community intelligence [1], ranging from urban environmentdynamics [2,3] to social events [4,5].
Research question
This work focuses on predicting humanmobility fromdiscovering patterns of in the number of passenger pick-ups quantity (PUQ) from urban hotspots.
Method
This paper proposes an improved ARIMA based prediction method to forecast the spatial-temporal variation of passengers in a hotspot.
Data set preprocessing and hotspot extraction
Xu J, Rahmatizadeh R, Bölöni L, et al. Real-time prediction of taxi demand using recurrent neural networks[J]. IEEE Transactions on Intelligent Transportation Systems, 2018, 19(8): 2572-2581.
Motivation
Predicting taxi demand throughout a city can help to organize the taxi fleet and minimize the wait-time for passen- gers and drivers.
TAXI drivers need to decide where to wait for passengers in order to pick up someone as soon as possible. Passengers also prefer to quickly find a taxi whenever they are ready for pickup. Effective taxi dispatching can help both drivers and passengers to minimize the wait-time to find each other.
Drivers do not have enough information about where passengers and other taxis are and intend to go. Therefore, a taxi center can organize the taxi fleet and efficiently distribute them according to the demand from the entire city [1], [2]. This taxi center is especially needed in the future where self-driving taxis need to decide where to wait and pick up passengers. To build such a taxi center, an intelligent system that can predict the future demand throughout the city is required.
Proposed method
we propose a real-time method for predicting taxi demands in different areas of a city.
We divide a big city into smaller areas and aggregate the number of taxi requests in each area during a small time period (e.g. 20 minutes). In this way, past taxi data becomes a data sequence of the number of taxi requests in each area.
Then, we train a Long Short Term Memory (LSTM) [9] recurrent neural network (RNN) with this sequential data. The network input is the current taxi demand and other relevant information while the output is the demand in the next time-step.
Zhang K, Feng Z, Chen S, et al. A framework for passengers demand prediction and recommendation[C]//Services Computing (SCC), 2016 IEEE International Conference on. IEEE, 2016: 340-347.
Motivation
With the rapid development of mobile internet and wireless network technologies, more and more people use the mobile app to call a taxicab to pick them up. Therefore, understanding the passengers’ travel demand becomes crucial to improve the utilization of the taxicabs and reduce their cost.
With the rapid development of mobile internet and wireless network technologies in these years, the transportation industry has been greatly changed. More and more passengers in cities are relying on different mobile apps, such as DiDi1, Uber2,CAR3, Yongche4, to call a taxicab to pick them up for travel. This makes the knowledge about the potential passengers’ requirements important and valuable, which is lack for many taxicab drivers, especially the novice-like drivers. Actually, understanding the travel requirements can not only help the drivers picking up passengers more quickly and earning more money, but also reduce the cruising time and energy waste. Therefore, how to understand the travel requirements for efficiency improvement becomes an important issue for the transportation industry.
Proposed method
Therefore, to deal with these issues, we present a demand hotspots prediction framework based on the spatio-temporal analysis to predict and recommend the hotspots for drivers. Based on the analysis of historical data, including when and where passengers get on a taxi, we generate the demand distribution to learn the patterns which can help to improve the performance of the spatio-temporal clustering. Then the hotness score for each hotspot is predicted to represent the potential requirement of the passengers. Considering the fact that it would take time for the drivers to reach a given location while the requirement is dynamic, the top-k locations which combines the hotness and the distance is visually presented for each taxi driver to help them improve the efficiency.
Contribution
-
An adaptive prediction approach is proposed to identify the hotspots and predict the hotness of the passenger demands based on the historical GPS data;
-
A method combing the hotness prediction and locations to calculate attractive score is presented to generate recommendation for each driver;
-
A visual prototype system is developed to prove the effectiveness of the presented framework, with hotspots distribution denoted by hotness score and hit ratio that taxi drivers succeed in picking up passengers in predicted places;
Yuan J, Zheng Y, Zhang L, et al. Where to find my next passenger[C]//Proceedings of the 13th international conference on Ubiquitous computing. ACM, 2011: 109-118.
Motivation
Taxicabs play an important role in people’s commute be- tween public and private transports. A significant number of people are traveling by taxis in their daily lives around the world. According to a recent survey about the taxi service of New York City [7], 41% people take a taxi per week and 25% of the respondents take a taxi everyday. However, on one hand, to facilitate people’s travel, major cities, like New York, Tokyo, London, and Beijing, have a huge number of taxis traversing in urban areas. The vacant taxis cruising on roads not only waste gas and time of a taxi driver but also generate additional traffic in a city. Thus, how to improve the utilization of these taxis and reduce the energy consumption effectively poses an urgent challenge. On the other hand, many people feel frustrated and anxious when they are un- able to find a taxicab after waiting for a long time.
Proposed method
We present a recommender for taxi drivers and people ex- pecting to take a taxi, using the knowledge of 1) passen- gers’ mobility patterns and 2) taxi drivers’ pick-up behav- iors learned from the GPS trajectories of taxicabs.
First, this recommender provides taxi drivers with some locations and the routes to these locations, towards which they are more likely to pick up passengers quickly (during the routes or at these locations) and maximize the profit. Second, it rec- ommends people with some locations (within a walking dis- tance) where they can easily find vacant taxis.
In our method, we learn the above knowledge (represented by probabilities) from GPS trajectories of taxis. Then, we feed the knowledge into a probabilistic model which estimates the profit of the candidate locations for a particular driver based on where and when the driver requests for the recommendation.
A). This recommendation helps to reduce the cruising (without a fare) time of a taxi thus saves energy con- sumption and eases the exhaust pollution as well as helps the drivers to make more profit.
On the other hand, we provide people expecting to take a taxi with the locations (within a walking distance) where they are most likely to find a vacant taxicab, as shown in Figure 1 B). Using our recommender, a taxi will find passengers more quickly and people will take a taxi more easily; therefore, reduces the above-mentioned problem to some extent.
Contribution
• We propose an approach for accurately detecting parking places from the GPS trajectories of a large number of taxis. These parking places stand for the locations where taxi drivers usually wait for passengers with their taxis parked. From these parking places, we can calculate the probability of picking up a passenger if the driver goes towards a parking place (including the situation that the driver picks up a passenger when cruising), hence, enable the recommender for taxi drivers.
• We devise a probabilistic model to formulate the time- dependent taxi behaviors (pick-up/drop-off/cruising/parking), both on road segments and in parking places, based on which, we build the recommendation solution for taxi driver- s and passengers. We devise a partition-and-group frame- work to learn the citywide statistical knowledge so as to provide just-in-time recommendations with time varying information learned from the historical data.
• We evaluate our method using a large number (12,000 taxis during 110 days) of historical GPS trajectories gen- erated by taxicabs. The evaluation results validate that our method can effectively suggest the taxi drivers with loca- tions towards which the driver can make more profit and save cruising time.
Chiang, Meng-Fen, Tuan-Anh Hoang, and Ee-Peng Lim. “Where are the passengers?: a grid-based gaussian mixture model for taxi bookings.” Proceedings of the 23rd SIGSPATIAL International Conference on Advances in Geographic Information Systems. ACM, 2015.
Motivation
Taxi bookings are events where requests for taxis are made by passengers either over voice calls or mobile apps. As the demand for taxis changes with space and time, it is important to model both the space and temporal dimensions in dynamic booking data. Several applications can benefit from a good taxi booking model. These include the prediction of number of bookings at certain location and time of the day, and the detection of anomalous booking events.
Proposed method
we propose a Grid-based Gaussian Mixture Model (GGMM) with spatio-temporal dimensions that groups booking data into a number of spatio-temporal clusters by observing the bookings occurring at different time of the day in each spatial grid cell. Using a large-scale real-world dataset consisting of over millions of booking records, we show that GGMM outperforms two strong baselines: a Gaussian Mixture Model (GMM) and the state-of-the-art spatio-temporal behavior model, Periodic Mobility Model (PMM), in estimating the spatio-temporal distribution of bookings at specific grid cells during specific time intervals. GGMM can achieve up to 95.8% (96.5%) reduction in perplexity compared against GMM (PMM). Further, we apply GGMM to detect anomalous bookings and successfully relate the anomalies with some known events, demonstrating GGMM’s e↵ectiveness in this task.
We learn the GGMMmodel with parameters phi from the observed data using the well-known expectation-maximization algorithm (EM).
Data
We conduct our research using three months of taxi booking data with more than few million bookings from approximately hundreds of thousands commuters in Singapore 1.
Contribution
• We propose a continuous and unified Grid-based Gaussian Mixture Model (GGMM) to model spatio-temporal taxi bookings considering both their static and dynamic factors. This model extends the well-known Gaussian Mixture Model (GMM) to consider grid-based booking rate so as to reflect the landscape constraints.
• We perform empirical analysis of large-scale booking data using GGMM and obtain interesting insights about the taxi booking patterns in Singapore. In addition to the differences between weekday and weekend bookings, we observe that rush hour bookings in the morning and evening are quite distinctive.
• We conduct a rigorous evaluation of GGMM in comparison with GMM and PMM when applying them to a prediction task using the booking data. Our experi- ments show that GGMM yields more accurate predic- tion results than the other two models.
• We further apply GGMM to detect anomalous booking data and relate them to o✏ine events in the city. The results show that GGMM is also e↵ective in this task.
Davis N, Raina G, Jagannathan K. A multi-level clustering approach for forecasting taxi travel demand[C]//Intelligent Transportation Systems (ITSC), 2016 IEEE 19th International Conference on. IEEE, 2016: 223-228.
Motivation
Previous studies on taxi model fitting and prediction mainly deal with predicting distribution of vacant taxis [10], recommender systems for taxi drivers and passengers based on the hotspots [14], and predicting human mobility from passenger pickups [7]. The work in [7] is closely related to ours – they predict the availability of pickups (similar to demand generated in our case) in a hotspot in the next time interval for China and specifically, an improved ARIMA model was observed as the best fit for their dataset. Empirically, we noticed that Indian traffic undergoes changes very rapidly from area to area, and hence a single unified model may not suffice. To the best of our knowledge, there has been little research on the Indian taxi demand modeling using data analysis. This is the focus of the current work.
Proposed method
In this paper, we use time-series modeling to forecast taxi travel demand, in the context of a mobile application- based taxi hailing service. In particular, we model the passenger demand density at various locations in the city of Bengaluru, India. Using the data, we first shortlist time-series models that suit our application. We then analyse the performance of these models by using Mean Absolute Percentage Error (MAPE) as the performance metric. In order to improve the model performance, we employ a multi-level clustering technique where we aggregate demand over neighboring cells/geohashes. We observe that the improved model based on clustering leads to a forecast accuracy of 80% per km2. In addition, our technique obtains an accuracy of 89% per km2 for the most frequently occurring use case.
Phithakkitnukoon S, Veloso M, Bento C, et al. Taxi-aware map: Identifying and predicting vacant taxis in the city[C]//International Joint Conference on Ambient Intelligence. Springer, Berlin, Heidelberg, 2010: 86-95.
Motivation
Knowing where vacant taxis are and will be at a given time and location helps the users in daily planning and scheduling, as well as the taxi service providers in dispatching.
Proposed method
In this paper, we present a predictive model for the number of vacant taxis in a given area based on time of the day, day of the week, and weather condition. The history is used to build the prior probability distributions for our inference engine, which is based on the na¨ıve Bayesian classifier with developed error-based learning algorithm and method for detecting adequacy of historical data using mutual information. Based on 150 taxis in Lisbon, Portugal, we are able to predict for each hour with the overall error rate of 0.8 taxis per 1x1 km2 area.
Afian A, Odoni A, Rus D. Inferring unmet demand from taxi probe data[C]//Intelligent Transportation Systems (ITSC), 2015 IEEE 18th International Conference on. IEEE, 2015: 861-868.
Motivation
Matching taxi supply with demand is one of the biggest challenges faced by taxi fleet operators today. One of the reasons why this problem is so hard to solve is because there are no readily available methods to infer unmet taxi demand from data.
An algorithm that reliably does so would be of enormous value to fleet operators because it could be used to dispatch available taxis to areas where passenger demand greatly exceeds supply.
Proposed method
In this paper, we formally define unmet taxi demand and develop a heuristic algorithm to quantify it. We explain how our method improves on traditional approaches and present the theoretical details which underpin our algorithm. Finally, we develop a smartphone application that uses our algorithm together with a live taxi data feed to provide real time recommendations to participating drivers and efficiently route taxis to where they are needed most.
We measure unmet taxi demand by the quantity U, which is the answer to the question: “How many more taxis are needed in an area to completely satisfy all taxi demand for a given period of time?”
Contribution
• a survey of current methods and strategies that take a data driven approach to taxi optimization
• a formal definition of unmet taxi demand and an algorithm to estimate it
• a rigorous analysis of the theoretical details which underpin our algorithm
• the development of an online recommendation engine and smartphone application that directs taxi drivers to areas of high unmet demand
Lee, Junghoon, Inhye Shin, and Gyung-Leen Park. “Analysis of the passenger pick-up pattern for taxi location recommendation.” 2008 Fourth International Conference on Networked Computing and Advanced Information Management. Vol. 1. IEEE, 2008.
Motivation
In Jeju island, Republic of Korea, the Taxi Telematics system has begun its service of real-time location tracking[1], efficient taxi dispatch, time-saving route finding, and many others. As in the case of other real- time tracking systems, this system needs to trace the current position of each vehicle as accurate as possible[2]. To this end, each taxi, equipped with a GPS (Global Positioning System) receiver and a wireless communication interface, reports its location record to the central call server. The in-vehicle telematics device builds a location record consist of timestamp, longitude, latitude, speed, direction, and status[3]. The status field indicates whether the taxi is carrying a passenger or empty. The call control server is responsible to keep such reports from each taxi and handles the call request from a customer by finding and dispatching a taxi closest to the call point.
Proposed method
This paper analyzes a pick-up pattern of taxi service in Jeju area based on the real-life location history data collected from the Taxi Telematics system, aiming at obtaining useful background data necessary to design a location recommendation service for empty taxis.
Liu L, Andris C, Ratti C. Uncovering cabdrivers’ behavior patterns from their digital traces[J]. Computers, Environment and Urban Systems, 2010, 34(6): 541-548.
Motivation
Recognizing high-level human behavior and decisions from their digital traces are critical issues in per- vasive computing systems.
Research question
What features of this very large database will lead to uncovering top drivers’ strategy? How do these successful drivers optimize over the bounded resources of space and time? Or are these drivers profiting by deliberately choosing routes that are more costly for the customer, as every out-of-towner fears when stepping into a taxicab in an unfamiliar city?
Proposed method
In this paper, we develop a novel methodology to reveal cabdrivers’ operation patterns by analyzing their continuous digital traces. For the first time, we systematically study large scale cabdrivers’ behavior in a real and complex city context through their daily digital traces. We identify a set of valuable features, which are simple and effective to classify cabdrivers, delineate cabdrivers’ oper- ation patterns and compare the different cabdrivers’ behavior. The methodology and steps could spatially and temporally quantify, visualize, and examine different cabdrivers’ operation patterns. Drivers were categorized into top drivers and ordinary drivers by their daily income. We use the daily operations of 3000 cabdrivers in over 48 million of trips and 240 million kilometers to uncover:
(1) spatial selection behavior,
(2) context-aware spatio-temporal operation behavior,
(3) route choice behavior, and
(4) operation tactics.
Though we focused on cabdriver operation patterns analysis from their digital traces, the methodology is a general empirical and analytical methodology for any GPS-like trace analysis. Our work demonstrates the great potential to utilize the massive pervasive data sets to understand human behavior and high-level intelligence.
Data
3000 cabdrivers, who take a total of 48 million trips covering 240 million kilometers for one year in Shenzhen, South China
Contribution
(1) For the first time, we systematically study large scale cabdrivers’ behavior in a real and complex city context (3000 taxis in a metropolitan area) through their daily digi- tal traces. We identify a set of valuable features, which are simple and effective to classify cabdrivers, delineate cabdrivers’ operation patterns and compare the different cabdrivers’ behavior.
(2) We develop a novel methodology and steps to spatially and temporally quantify, visualize, and examine cabdrivers’ operation patterns. Drivers are categorized into top drivers and ordinary drivers by their daily income. We use the daily operations of 3000 cabdrivers in over 48 million of trips and 240 million kilometers to uncover the differences between top drivers and ordinary drivers: (1) spatial selection behavior, (2) context-aware spatio-temporal operation behavior, (3) route choice behavior, and (4) operation tactics.
Gonzalez M C, Hidalgo C A, Barabasi A L. Understanding individual human mobility patterns[J]. nature, 2008, 453(7196): 779.
Motivation
Despite their importance for urban planning1, traffic forecasting2 and the spread of biological3–5 and mobile viruses6 , our understanding of the basic laws governing human motion remains limited owing to the lack of tools to monitor the time-resolved location of individuals.
Proposed method
Here we study the trajectory of 100,000 anonymized mobile phone users whose position is tracked for a six-month period. We find that, in contrast with the random tra- jectories predicted by the prevailing Le´vy flight and random walk models7 , human trajectories show a high degree of temporal and spatial regularity, each individual being characterized by a time- independent characteristic travel distance and a significant prob- ability to return to a few highly frequented locations. After correcting for differences in travel distances and the inherent anisotropy of each trajectory, the individual travel patterns col- lapse into a single spatial probability distribution, indicating that, despite the diversity of their travel history, humans follow simple reproducible patterns. This inherent similarity in travel patterns could impact all phenomena driven by human mobility, from epidemic prevention to emergency response, urban planning and agent-based modelling. Given
Li B, Zhang D, Sun L, et al. Hunting or waiting? Discovering passenger-finding strategies from a large-scale real-world taxi dataset[C]//Pervasive Computing and Communications Workshops (PERCOM Workshops), 2011 IEEE International Conference on. IEEE, 2011: 63-68.
Motivation
In modern cities, more and more vehicles, such as taxis, have been equipped with GPS devices for localization and navigation. Gathering and analyzing these large-scale real- world digital traces have provided us an unprecedented opportunity to understand the city dynamics and reveal the hidden social and economic “realities”. One innovative pervasive application is to provide correct driving strategies to taxi drivers according to time and location.
Proposed method
In this paper, we aim to discover both efficient and inefficient passenger-finding strategies from a large-scale taxi GPS dataset, which was collected from 5350 taxis for one year in a large city of China. By representing the passenger-finding strategies in a Time- Location-Strategy feature triplet and constructing a train/test dataset containing both top- and ordinary-performance taxi features, we adopt a powerful feature selection tool, L1-Norm SVM, to select the most salient feature patterns determining the taxi performance. We find that the selected patterns can well interpret the empirical study results derived from raw data analysis and even reveal interesting hidden “facts”. Moreover, the taxi performance predictor built on the selected features can achieve a prediction accuracy of 85.3% on a new test dataset, and it also outperforms the one based on all the features, which implies that the selected features are indeed the right indicators of the passenger-finding strategies.
Anwar A, Volkov M, Rus D. Changinow: A mobile application for efficient taxi allocation at airports[C]//Intelligent Transportation Systems-(ITSC), 2013 16th International IEEE Conference on. IEEE, 2013: 694-701.
Proposed method
We present an application that uses a predictive queueing model to efficiently allocate taxis. The system uses observed taxi and flight data at each of the four terminals of Singapore’s Changi Airport to estimate the expected waiting time and queue length for taxis arriving at these terminals, and then sends taxis to terminals where demand is highest. We propose a service model that enables our system to be deployed on a smartphone platform to participating taxi drivers. We present the theoretical details which underpin our prediction engine and corroborate our theory with several targeted numer- ical simulations. Finally, we evaluate the performance of this system in large-scale experiments and show that our system achieves a significant improvement in both passenger and taxi waiting time.
Contribution
• data mining algorithms to find the average waiting time, arrival rate, departure rate and queue length of taxis waiting at any given terminal,
• a first study on quantifying the imbalance of taxi supply at terminals of airports,
• a queuing model and an automated planning system that can be used to send taxis to an airport terminal when demand is high,
• lastly, a direct comparison between simulated taxi and passenger waiting times in the current system versus one that uses ChangiNOW
Ge Y, Xiong H, Tuzhilin A, et al. An energy-efficient mobile recommender system[C]//Proceedings of the 16th ACM SIGKDD international conference on Knowledge discovery and data mining. ACM, 2010: 899-908.
Motivation
The increasing availability of large-scale location traces cre- ates unprecedent opportunities to change the paradigm for knowledge discovery in transportation systems. A partic- ularly promising area is to extract energy-efficient trans- portation patterns (green knowledge), which can be used as guidance for reducing inefficiencies in energy consumption of transportation sectors. However, extracting green knowl- edge from location traces is not a trivial task. Conventional data analysis tools are usually not customized for handling the massive quantity, complex, dynamic, and distributed na- ture of location traces.
Proposed method
To that end, in this paper, we provide a focused study of extracting energy-efficient transportation patterns from location traces. Specifically, we have the initial focus on a sequence of mobile recommendations. As a case study, we develop a mobile recommender system which has the ability in recommending a sequence of pick-up points for taxi drivers or a sequence of potential parking positions. The goal of this mobile recommendation system is to max- imize the probability of business success. Along this line, we provide a Potential Travel Distance (PTD) function for evaluating each candidate sequence. This PTD function pos- sesses a monotone property which can be used to effectively prune the search space. Based on this PTD function, we develop two algorithms, LCP and SkyRoute, for finding the recommended routes. Finally, experimental results show that the proposed system can provide effective mobile se- quential recommendation and the knowledge extracted from location traces can be used for coaching drivers and leading to the efficient use of energy.
Azevedo, José, Pedro M. d’Orey, and Michel Ferreira. “On the mobile intelligence of autonomous vehicles.” NOMS 2016-2016 IEEE/IFIP Network Operations and Management Symposium. IEEE, 2016.
Motivation
Despite impressive developments in autonomous driving technology, little work has been devoted to improving the mobility intelligence of self-driving vehicles. Intelligent transport mobility, where cars autonomously or collaborative take mobility decisions, will be of major importance for future transportation systems.
Proposed method
Through a large-scale data analysis, we empirically evaluate the patterns of high performing taxi drivers and taxi stands. We also empirically show that advanced vehicle positioning can be beneficial for taxi operators by quantifying the impact of a taxi stand selection system that uses knowledge of passenger demand. Results show that a judicious selection of taxi stands allows decreasing the idle time and travelled distance, and improving the hourly revenue. The implementation of the system allows decreasing the operators’ operational expenditures and improving profitability.
Calabrese F, Pereira F C, Di Lorenzo G, et al. The geography of taste: analyzing cell-phone mobility and social events[C]//International conference on pervasive computing. Springer, Berlin, Heidelberg, 2010: 22-37.
Motivation
Even when the exact number of event atten- dees is known, it is still difficult to predict their effect on the city systems when traveling to and from the event. During the last years, the Pervasive Computing community has developed technologies that now allow us to face the challenge in new ways. Due to their ubiquity, GSM, bluetooth or WiFi localization tech- nologies such as in [1,2,3] can now be explored at a large scale.
In 2008, a study from the U.S. Federal Highway Administration [4] was dedi- cated to investigate the economic and congestion effects of large planned special events (PSEs) on a national level. The clearer understanding of the scale of PSEs and their economic influence is essential to achieve a more efficient transporta- tion planning and management of traffic logistics of such events. In that study, the authors find that there are approximately 24,000 PSEs annually with over 10,000 in attendance across USA, or approximately 470 per week. These num- bers, possibly similar in other parts of the world, call for application of efficient techniques of crowd analysis. From the point of view of Pervasive Computing, besides the very task of analyzing digital footprints obtained from ubiquitous de- vices, which lies in the crux of this research, other questions arise that transcend this area.
Proposed method
This paper deals with the analysis of crowd mobility during special events. We analyze nearly 1 million cell-phone traces and associate their destinations with social events. We show that the origins of people attending an event are strongly correlated to the type of event, with implications in city management, since the knowledge of additive flows can be a critical information on which to take decisions about events management and congestion mitigation.
Calabrese F, Pereira F C, Di Lorenzo G, et al. The geography of taste: analyzing cell-phone mobility and social events[C]//International conference on pervasive computing. Springer, Berlin, Heidelberg, 2010: 22-37.
Motivation
Being able to understand and predict crowded events is a challenge that any urban manager faces regularly, particularly in big cities. When it is not possible to determine the exact numbers (e.g., from ticket sales), the typical approach is based on intuition and experience. Even when the exact number of event atten- dees is known, it is still difficult to predict their effect on the city systems when traveling to and from the event. During the last years, the Pervasive Computing community has developed technologies that now allow us to face the challenge in new ways. Due to their ubiquity, GSM, bluetooth or WiFi localization tech- nologies such as in [1,2,3] can now be explored at a large scale.
Reserch goal
The objective is to characterize the relationship between events and its attendees, more specifically of their home area. The hypothesis is that different kinds of events bring people from different areas of the city according to distribution patterns that maintain some degree of constancy.
Proposed method
This paper deals with the analysis of crowd mobility during special events. We analyze nearly 1 million cell-phone traces and asso- ciate their destinations with social events. We show that the origins of people attending an event are strongly correlated to the type of event, with implications in city management, since the knowledge of additive flows can be a critical information on which to take decisions about events management and congestion mitigation.
Data
anonymous cellular phone signaling data collected by AirSage.
Boston Globe event website [19] and selected 6 different venues, corresponding to a total of 52 events.
Result
Our results show that there is a strong correlation in that: people who live close to an event are preferentially attracted by it; events of the same type show similar spatial distribution of origins. As a consequence, we could partly predict where people will come from for future events.
Pereira F C, Rodrigues F, Polisciuc E, et al. Why so many people? explaining nonhabitual transport overcrowding with internet data[J]. IEEE Transactions on Intelligent Transportation Systems, 2015, 16(3): 1370-1379.
Motivation
Public transport smartcard data can be used to detect large crowds. By comparing smartcard data with statistics on habitual behavior (e.g. average by time of day), one can specifically identify non-habitual crowds, which are often prob- lematic for the transport system. While habitual overcrowding (e.g. during peak hour) is well understood by traffic managers and travelers, non-habitual overcrowding hotspots can be very disruptive given that they are generally unexpected. By quickly understanding and reacting to cases of overcrowding, transport managers can mitigate transport system disruptions.
Research goal
This paper aims to address the following problems: what are the potential causes of a non-habitual large crowd (an overcrowding hotspot); and how do these potential causes indi- vidually contribute to the overall impact? We will particularly focus on public transport overcrowding in special events areas.
Proposed method
We propose a probabilistic data analysis model that breaks each non-habitual overcrowding hotspot into a set of explanatory components. Potential explanatory components are retrieved from social networks and special events websites and then processed through text-analysis techniques. We then use the probabilistic model to estimate each components specific share of total over-crowding counts.
We first validate with synthetic data and then test our model with real data from Singapores public transport system (EZLink), focused on 3 case study areas. We demonstrate that it is able to generate explanations that are intuitively plausible and consistent both locally (correlation coefficient, CC, from 85% to 99% for the 3 areas) and globally (CC from 41.2% to 83.9%).
This model is directly applicable to domains that are sensitive to crowd formation due to large social events (e.g. communications, water, energy, waste).
IDENTIFYING OVERCROWDING HOTSPOTS
RETRIEVING POTENTIAL EXPLANATIONS FROM THE WEB
BAYESIAN HIERARCHICAL ADDITIVE MODEL
Pereira F C, Rodrigues F, Ben-Akiva M. Using data from the web to predict public transport arrivals under special events scenarios[J]. Journal of Intelligent Transportation Systems, 2015, 19(3): 273-288.
Motivation
The Internet has become the preferred resource to announce, search, and comment about social events such as concerts, sports games, parades, demonstrations, sales, or any other public event that potentially gathers a large group of people. These planned special events often carry a potential disruptive impact to the transportation system, because they correspond to nonhabitual behavior patterns that are hard to predict and plan for. Except for very large and mega events (e.g., Olympic games, football world cup), operators seldom apply special planning measures for two major reasons: The task ofmanually tracking which events are happening in large cities is labor-intensive; and, even with a list ofevents, their impact is hard to estimate, especially when more than one event happens simultaneously.
Proposed method
In this article, we utilize the Internet as a resource for contextual information about special events and develop a model that predicts public transport arrivals in event areas. In order to demonstrate the feasibility of this solution for practitioners, we apply off-the-shelf techniques both for Internet data collection and for the prediction model development. We demonstrate the results with a case study from the city-state ofSingapore using public transport tap-in/tap-out data and local event information obtained from the Internet.
CHANG M S, LU P R. A multinomial logit model of mode and arrival time choices for planned special events[J]. Journal of the Eastern Asia Society for Transportation Studies, 2013, 10: 710-727.
Motivation
A concert activity, one kind of planned special event, frequently causes congestion and unexpected delays for travelers.
Planned special events (PSE) include sporting events, concerts, festivals, and conventions occurring at permanent multi-use venues as well as less frequent public events occurring at temporary venues, such as parades, fireworks displays, bicycle races, sporting games, motorcycle rallies, and seasonal festivals. Unlike emergency special events (ESE), PSEs occur at known locations and at scheduled times. PSEs create an increase in travel demands and produce significant site-specific or even regional impacts such as severe traffic congestion or transit overcrowding. Related transportation system operations are also affected, such as freeway operations, arterial and other street operations, transit operations, and pedestrian flow (FHWA, 2009). Authorities must manage the intense travel demands of PSEs to order to maintain transportation system safety, mobility, and reliability. The challenges they face include mitigating potential capacity constraints, accommodating heavy pedestrian flow, and influencing the utility associated with various travel choices.
Proposed method
The purpose of this study is to investigate concert participants’ behaviors regarding mode and arrival time choices. A multinominal logit model is estimated to explore the most effective factors in their travel choices. A personal interview survey with 1008 respondents was conducted at Taipei Arena. The results show that significant explanatory variables of this travel choices model include total travel cost, total travel time, gender, age, household income, total number of motorcycles owned by a household, trip origin, fan seniority, expected time of arrival relative to the concert start time, single-stop trip or not, and first-time visiting or not. Our research results can assist in predicting time-dependent travel demands of each mode of concert participators in the case of planned special events.
Kuppam A, Copperman R, Rossi T, et al. Innovative methods for collecting data and for modeling travel related to special events[J]. Transportation Research Record, 2011, 2246(1): 24-31.
Motivation
The Maricopa Association of Governments (MAG) is the designated metropolitan planning organization for the Phoenix, Arizona, metropol- itan area. In collaboration with local transit agencies and local jurisdic- tions, MAG developed a successful proposal to compete for FTA Alternatives Analysis Discretionary Program Section 5339 funds. The proposal included development of the special events model and special events data collection. The importance of this task was highlighted by the success of the introduction of light rail transit in the region. The need for better understanding and forecasting of transit markets required in-depth study and modeling of planned special events in the region. Special events patrons constituted a significant portion of light rail rider- ship and overall regional travel demand.
Wu F, Wang H, Li Z. Interpreting traffic dynamics using ubiquitous urban data[C]//Proceedings of the 24th ACM SIGSPATIAL International Conference on Advances in Geographic Information Systems. ACM, 2016: 69.
Motivation
Given a large collection of urban datasets, how can we find their hidden correlations? For example, New York City (NYC) provides open access to taxi data from year 2012 to 2015 with about half million taxi trips generated per day. In the meantime, we have a rich set of urban data in NYC including points-of-interest (POIs), geo-tagged tweets, weather, vehicle collisions, etc. Is it possible that these ubiquitous datasets can be used to explain the city traf- fic? Understanding the hidden correlation between external data and traffic data would allow us to answer many important questions in urban computing such as: If we observe a high traffic volume at Madison Square Garden (MSG) in NYC, is it because of the regular peak hour or a big event being held at MSG? If a disaster weather such as a hurricane or a snow storm hits the city, how would the traffic be affected? Most of existing studies on traffic dynamics focus only on traffic data itself and do not seek for external datasets to explain traffic.
Contribution
• We study a novel and important problem in urban computing: understanding traffic using ubiquitous urban data. • We investigate how to design features and models to capture the correlations between traffic and different types of urban data. • Our experiments show that external datasets can be helpful in interpreting taxi traffic.
Ding, Xiao, et al. “Deep learning for event-driven stock prediction.” Twenty-fourth international joint conference on artificial intelligence. 2015.
Proposed method
We propose a deep learning method for event- driven stock market prediction. First, events are extracted from news text, and represented as dense vectors, trained using a novel neural tensor net- work. Second, a deep convolutional neural network is used to model both short-term and long-term in- fluences of events on stock price movements. Ex- perimental results show that our model can achieve nearly 6% improvements on S&P 500 index predic- tion and individual stock prediction, respectively, compared to state-of-the-art baseline methods. In addition, market simulation results show that our system is more capable of making profits than pre- viously reported systems trained on S&P 500 stock historical data.
Ding X, Zhang Y, Liu T, et al. Knowledge-driven event embedding for stock prediction[C]//Proceedings of COLING 2016, the 26th International Conference on Computational Linguistics: Technical Papers. 2016: 2133-2142.
Motivation
Representing structured events as vectors in continuous space offers a newway for defining dense features for natural language processing (NLP) applications. Prior work has proposed effective methods to learn event representations that can capture syntactic and semantic information over text corpus, demonstrating their effectiveness for downstream tasks such as event-driven stock prediction. On the other hand, events extracted from raw texts do not contain background knowl- edge on entities and relations that they are mentioned.
Literature review
Knowledge Graph Embedding Recently, several methods have been explored to represent and encode knowledge graph (Bordes et al., 2013; Bordes et al., 2014; Chang et al., 2013; Ji et al., 2015; Lin et al., 2015) in distributed vectors. In this line of work, each entity is represented as a d-dimensional vector and each relation between two entities is modeled by using a matrix or a tensor. Most existing methods learn knowledge embeddings by minimizing a global loss function over all the entities and relations in a knowledge graph. Entity vectors can encode global information over the knowledge graph, and hence are useful for knowledge graph completion (Socher et al., 2013). In this paper, we encode entity vectors into the learning process for event embeddings, so that information of knowledge graphs can be used for event-driven text mining and other tasks. Socher et al. (2013) has shown that previous work (Bordes et al., 2011; Jenatton et al., 2012; Bordes et al., 2012; Sutskever et al., 2009; Collobert and Weston, 2008) are special cases of their model, which is based on a neural tensor network. We follow Socher et al. (2013) and use tensors to represent relations in knowledge graph embeddings.
Proposed method
To address this issue, this paper proposes to leverage extra information from knowledge graph, which provides ground truth such as attributes and properties of entities and encodes valuable relations between entities. Specifically, we propose a joint model to combine knowledge graph information into the objective function of an event embedding learning model. Experiments on event similarity and stock market prediction show that our model is more capable of obtaining better event embeddings and making more accurate prediction on stock market volatilities.
Useful information
the main advantages of event embeddings include (1) they can capture both the syntactic and the semantic information among events and (2) they can be used to alleviate the sparsity of discrete events compared with one-hot feature vectors. The learning principle is that events are syntactically or semantically similar should have similar vectors.
This form of event embedding method suffers from some limitations. First, the obtained event embeddings cannot capture the relationship between two syn- tactically or semantically similar events if they do not have similar word vectors. On the other hand, two events with similar word embeddings, such as “Steve Jobs quits Apple” and “John leaves Starbucks” may have similar embeddings despite that they are quite unrelated. One important reason for the problem is the lack of background knowledge in training event embeddings. In particular, if it is known that “Steve Jobs” is the CEO of “Apple”, and “John” is likely to be a customer at “Starbucks”, the two events can have
It commonly contains two forms of knowledge: categorical knowledge and relational knowledge. Both categorical knowledge and relational knowledge are useful for improving event embeddings. More specifically, categorical knowledge can be used for correlating entities with similar attributes, and relational knowledge can be used to differentiate event pairs with similar word embeddings. We
Ding X, Zhang Y, Liu T, et al. Using structured events to predict stock price movement: An empirical investigation[C]//Proceedings of the 2014 Conference on Empirical Methods in Natural Language Processing (EMNLP). 2014: 1415-1425.
Motivation
It has been shown that news events influ- ence the trends of stock price movements. However, previous work on news-driven stock market prediction rely on shallow features (such as bags-of-words, named entities and noun phrases), which do not capture structured entity-relation informa- tion, and hence cannot represent complete and exact events. Recent advances in Open Information Extraction (Open IE) techniques enable the extraction of structured events from web-scale data.
previous work represents news documents mainly using simple features, such as bags-of-words, noun phrases, and named entities (Lavrenko et al., 2000; Kogan et al., 2009; Luss and d’Aspremont, 2012; Schumaker and Chen, 2009). With these unstructured features, it is dif- ficult to capture key events embedded in financial news, and even more difficult to model the impact of events on stock market prediction. For exam- ple, representing the event “Apple has sued Sam- sung Electronics for copying ‘the look and feel’ of its iPad tablet and iPhone smartphone.” using term-level features {“Apple”, “sued”, “Samsung”, “Electronics”, “copying”, …} alone, it can be dif- ficult to accurately predict the stock price move- ments of Apple Inc. and Samsung Inc., respec- tively, as the unstructured terms cannot indicate the actor and object of the event.
Proposed method
We propose to adapt Open IE technology for event-based stock price movement pre- diction, extracting structured events from large-scale public news without manual efforts. Both linear and nonlinear mod- els are employed to empirically investigate the hidden and complex relationships be- tween events and the stock market. Large- scale experiments show that the accuracy of S&P 500 index prediction is 60%, and that of individual stock prediction can be over 70%. Our event-based system out- performs bags-of-words-based baselines, and previously reported systems trained on S&P 500 stock historical data.
2.1 Event Representation
2.2 Event Extraction
2.3 Event Generalization
2.4 Prediction Models
2.5 Feature Representation
Contribution
A main contribution of our work is to extract and use structured events instead of bags-of-words in prediction models.
Ding X, Qin B, Liu T. Building chinese event type paradigm based on trigger clustering[C]//Proceedings of the Sixth International Joint Conference on Natural Language Processing. 2013: 311-319.
Motivation
Traditional Event Extraction mainly focuses on event type identification and event partici- pants extraction based on pre-specified event type annotations. However, different domains have different event type paradigms. When transferring to a new domain, we have to build a new event type paradigm. It is a costly task to discover and annotate event types manually.
Proposed method
To address this problem, this paper proposes a novel approach of building an event type para- digm by clustering event triggers. Based on the trigger clusters, the event type paradigm can be built automatically. Experimental re- sults on three different corpora – ACE (small, homogeneous, open corpus), Financial News and Musical News (large scale, specific do- main, web corpus) indicate that our method can effectively build an event type paradigm and can be easily adapted to new domains.
Our approach involves three steps:
1) we introduce a trigger extraction algorithm based on the de- pendency syntactic structure;
2) a trigger filter is then constructed to remove some noisy candidate triggers;
3) we develop an event type discovery algorithm based on our proposed trigger clustering methods. The clustered event types are used to construct an event type paradigm
2.1 Trigger Extractor
2.2 Trigger Filter
2.3 Trigger Clustering and Event Type Paradigm Building
Contribution
-
In this paper, we put forward the problem of event type paradigm building, and develop a novel framework as the solution.
-
This paper exploits a series of novel algorithms for automatically discovering and clustering domain independent event types.
Rospocher M, van Erp M, Vossen P, et al. Building event-centric knowledge graphs from news[J]. Web Semantics: Science, Services and Agents on the World Wide Web, 2016, 37: 132-151.
Motivation
Knowledge graphs have gained increasing popularity in the past couple of years, thanks to their adoption in everyday search engines. Typically, they consist of fairly static and encyclopedic facts about persons and organizations – e.g. a celebrity’s birth date, occupation and family members – obtained from large repositories such as Freebase or Wikipedia.
To construct an ECKG, we have identified four main information extraction challenges:
(i) proper modeling of the expression of information in text and the referential value of the expression in the formal semantic ECKG model;
(ii) correctly extracting and interpreting the information contained in a news article, according to the ECKG data model;
(iii) linking the extracted information to established linked data repositories (e.g., DBpedia);
(iv) establishing referential identity for entities and events across different expressions and mentions within and across different sources (e.g., same entity or event mentioned in different news articles), potentially in different languages.
Proposed method
In this paper, we present a method and tools to automatically build knowledge graphs from news articles. As news articles describe changes in the world through the events they report, we present an approach to create Event-Centric Knowledge Graphs (ECKGs) using state-of-the-art natural language processing and semantic web techniques. Such ECKGs capture long-term developments and histories on hundreds of thousands of entities and are complementary to the static encyclopedic information in traditional knowledge graphs. We describe our event-centric representation schema, the challenges in extracting event information
from news, our open source pipeline, and the knowledge graphs we have extracted from four different news corpora: general news (Wikinews), the FIFA world cup, the Global Automotive Industry, and Airbus A380 airplanes. Furthermore, we present an assessment on the accuracy of the pipeline in extracting the triples of the knowledge graphs. Moreover, through an event-centered browser and visualization tool we show how approaching information from news in an event-centric manner can increase the user’s understanding of the domain, facilitates the reconstruction of news story lines, and enable to perform exploratory investigation of news hidden facts.
Contribution
- a definition of Event-Centric Knowledge Graphs (Section 1)
-
a formal semantic representation for ECKGs that includes reference to the original source (Section 3)
-
a method and open source tools for the extraction of Event- Centric Knowledge Graphs in four languages (Section 4)
- four openly available ECKGs (Section 5) 5. a first assessment of the quality of automatically created ECKGs (Section 6).